Definition
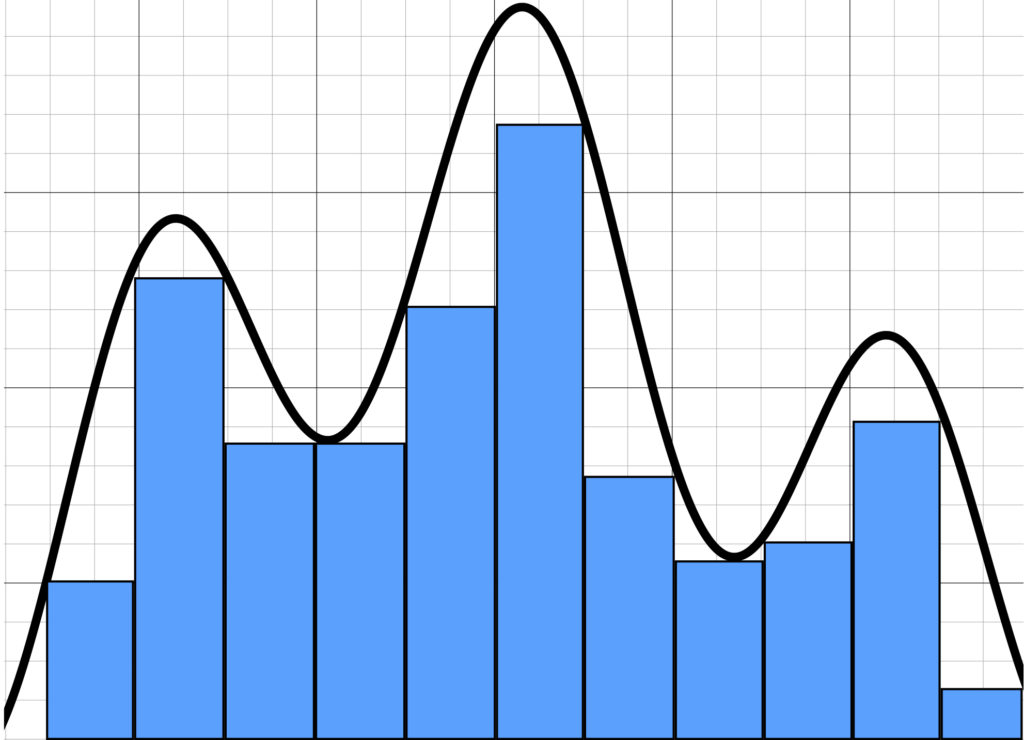
So what is an integral? One definition is that an integral is a mathematical tool to find the area under a curve. To see how it works, consider the following diagram:

We can at least get an estimate of the area under the curve in the graph shown above by drawing rectangles. Note that, in the graph, there is a considerable amount of “white” between the blue rectangles and the curve. This indicates that the accuracy of our estimate is limited.
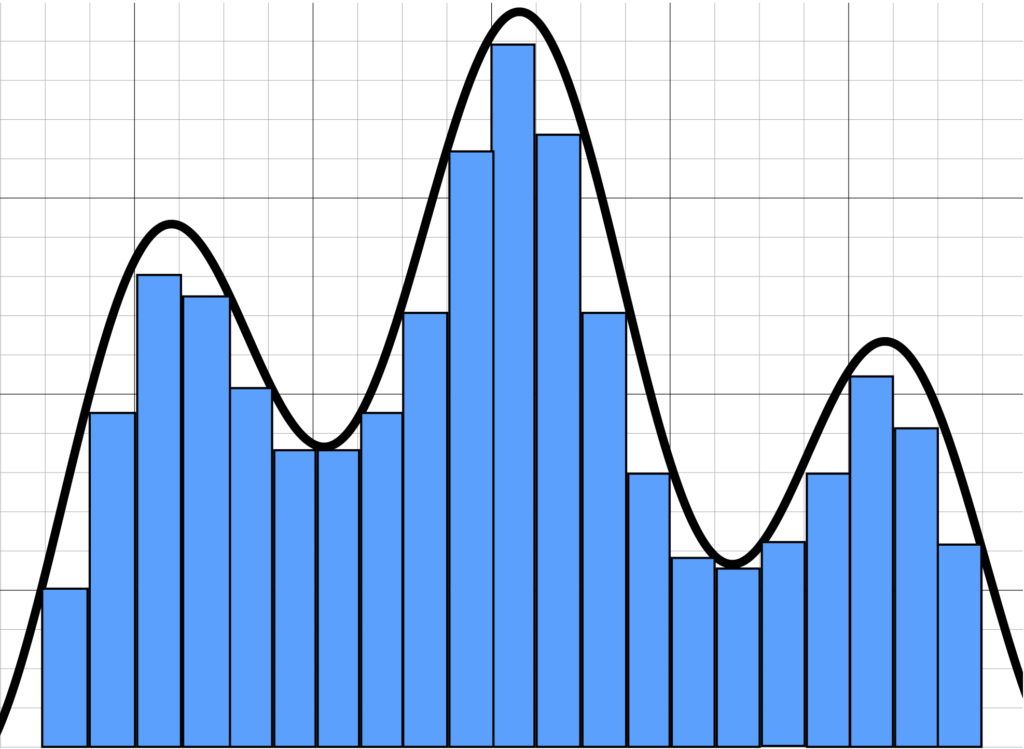
We can make our estimate better by making the rectangles we use to measure narrower, like so:

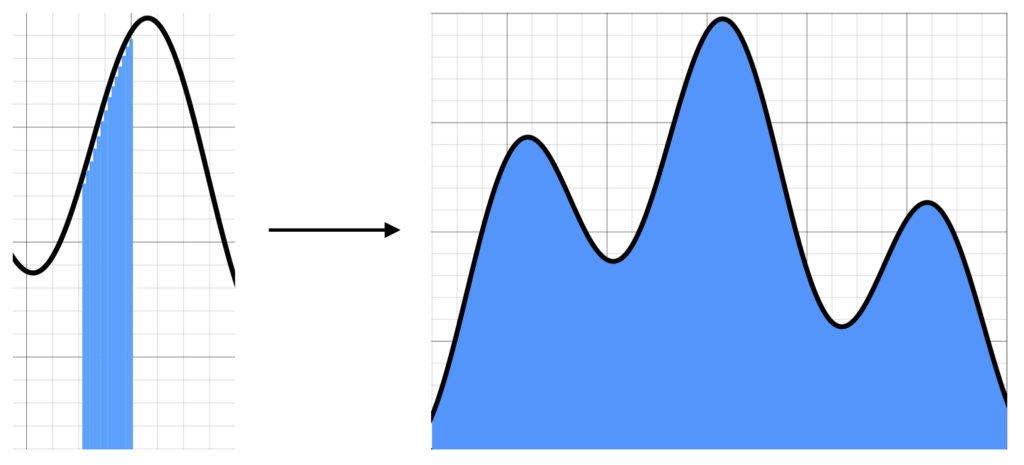
The above estimate looks better, with less white space. This suggests that if we continue to make our rectangles narrower and narrower, eventually making them infinitesimally small, we should eventually get the true area under the curve:

The above graphs can be described mathematically as follows:
 where
where ![]()
In the above equation,
 is the value of the curve, specified on the y-axis.
  is an infinitesimal displacement along the x-axis.
  means multiply
  and
and  together.
  is the integral sign. It means, find the area under the curve specified by
  and the
  axis that lies between
  and
and  .
. - The right side of the equation tells us how to find the integral on the left side of the equation.
 means that the right side of the equation is an approximation of the left side.
 - The manner in which this approximation is carried out is by adding up the area of a bunch of very narrow rectangles together-that is, take their sum. The mathematical symbols that tells us to take a sum is
 .
. - The thing that we’re to take the sum of is to the right of the
 symbol. In this case, the equation says to take the sum of the product of
  times
times  at multiple sites along the
  axis.
axis. - The product
 gives the area under the very narrow rectangles.
  tells us where along the
  axis to take those products.
  is the width of the rectangles whose areas we’re going to add up to approximate the integral. This is given by dividing
  (the length along the x-axis for which we’re going to measure the area under
  ) by
) by  , the number of tiny rectangles whose areas we’re going to add together.
 - The number below and on top of the
 sign are references to the various tiny rectangles we’re going to add up.
  refers to the first rectangle we’re going to use to contribute to our sum, under the left-most aspect of the curve.
  is an integer that refers to the right-most rectangle we’re going to use.
The expression  is called a Riemann sum (named after Bernhard Riemann, the eighteenth century mathematician who invented it). Application of the above mathematical methods to figure 7 may make the way that these methods work more clear.
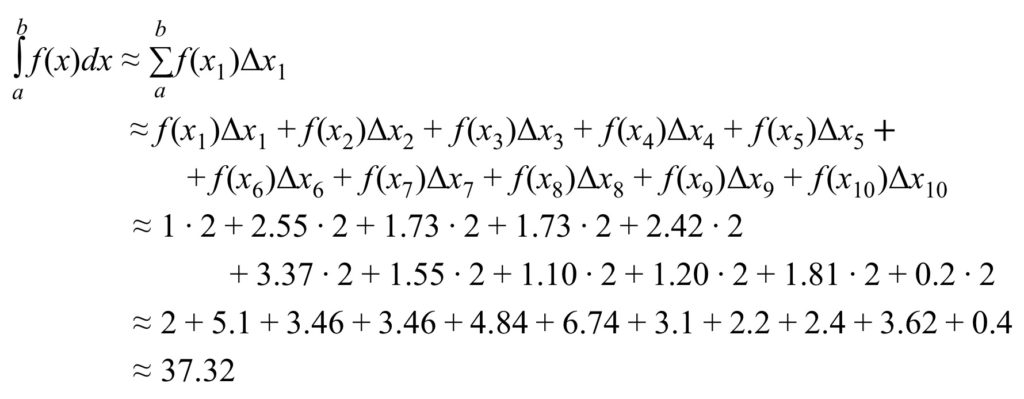
Figure 7 can be expressed mathematically as follows:

Here are a few comments of explanation regarding the above equations:
-
 is the value on the vertical (y) axis corresponding to the left-hand margin of the left-most first rectangle. It is the height of the rectangle.
  is the width of the base of that rectangle.
- The area of that rectangle is the height times the base, i.e.,
 .
. - Add up the areas of all of the rectangles and we have an estimate of the area under the curve.
We could go through the same exercise with figure 8 but it would be tedious and essentially the same as that given for figure 7. Therefore, let’s move on to figure 9 and give the mathematical expression for the exact value of the area under a curve:
 where
where ![]()
In this expression, ![]() means that, in order to get an exact value for the area under the curve,
means that, in order to get an exact value for the area under the curve, ![]() , we would need to take the sum of the area of an infinite number of very narrow rectangles. As the above diagrams show, as the number of rectangles becomes very large-and their widths become very narrow-they “point to” the exact value.
, we would need to take the sum of the area of an infinite number of very narrow rectangles. As the above diagrams show, as the number of rectangles becomes very large-and their widths become very narrow-they “point to” the exact value.
The formal mathematical definition of the integral goes like this:
The statement
 where
where ![]()
is true if and only if
- for every number

- where

- where
- there exists some number

- where the length of the mesh of the partitions (i.e., the length of the widest of the “little rectangles” we’re adding together to find the area) is
 .
.
- where the length of the mesh of the partitions (i.e., the length of the widest of the “little rectangles” we’re adding together to find the area) is
That is, if we make ![]() (i.e., the width of the partitions) smaller and smaller, then
(i.e., the width of the partitions) smaller and smaller, then ![]() gets closer and closer to the true area under the graph of a function (i.e., the “error” between the limit and the “true” area under the curve – which is
gets closer and closer to the true area under the graph of a function (i.e., the “error” between the limit and the “true” area under the curve – which is ![]() – gets smaller and smaller, moving “toward” zero but never quite making it to zero).
– gets smaller and smaller, moving “toward” zero but never quite making it to zero).
