Table of Contents
- Preface
- I. Line Integrals
- II. Surface Integrals
- III. 3D Flux
- IV. Green’s Theorem
- V. 2D Divergence Theorem
- VI. Stokes’ Theorem
- VII. 3D Divergence Theorem
Preface
These are my notes on multivariable calculus. This is by no means an exhaustive list of topics. Rather, it includes selective topics – often information for which I have a need elsewhere on this website. Most of the material on this page is patterned after the Multivariable Calculus Section at Khan Academy.
I. Line Integrals
I.1 Line Integral of a Curve
I.1.1 Derivation
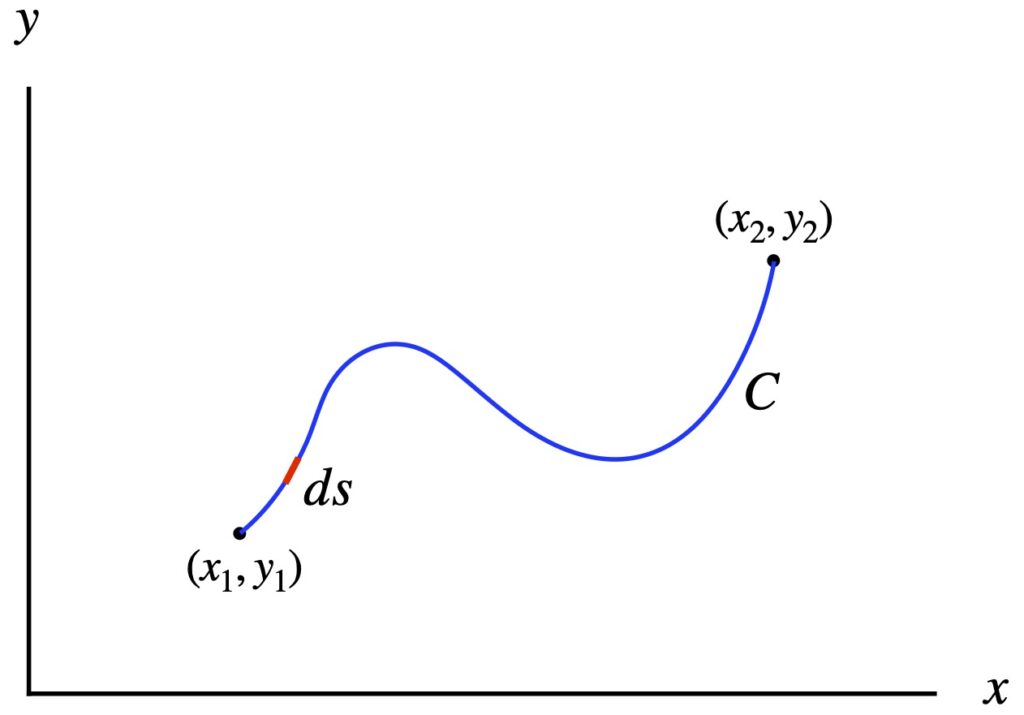
In figure 1.1.1.1, we have a blue curve, C. We want to find its length. Our strategy will be to divide the curve up into infinitesimal segments (ds, red) tangent to C, find the length of these segments and add them all up. Mathematically, this amounts to taking an integral:
![]()
where
 is the total length of
 is the length of the infinitesimal elements that we want to add
The length of ![]() is given by the Pythagorean theorem:
is given by the Pythagorean theorem:
![]()
If we’re talking about the a 2D curve in the x-y plane, then we can define our curve as:
![]()
Then our infinitesimal length element is:
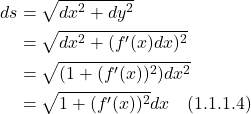
And our integral becomes:
![]()
I.1.2 Example
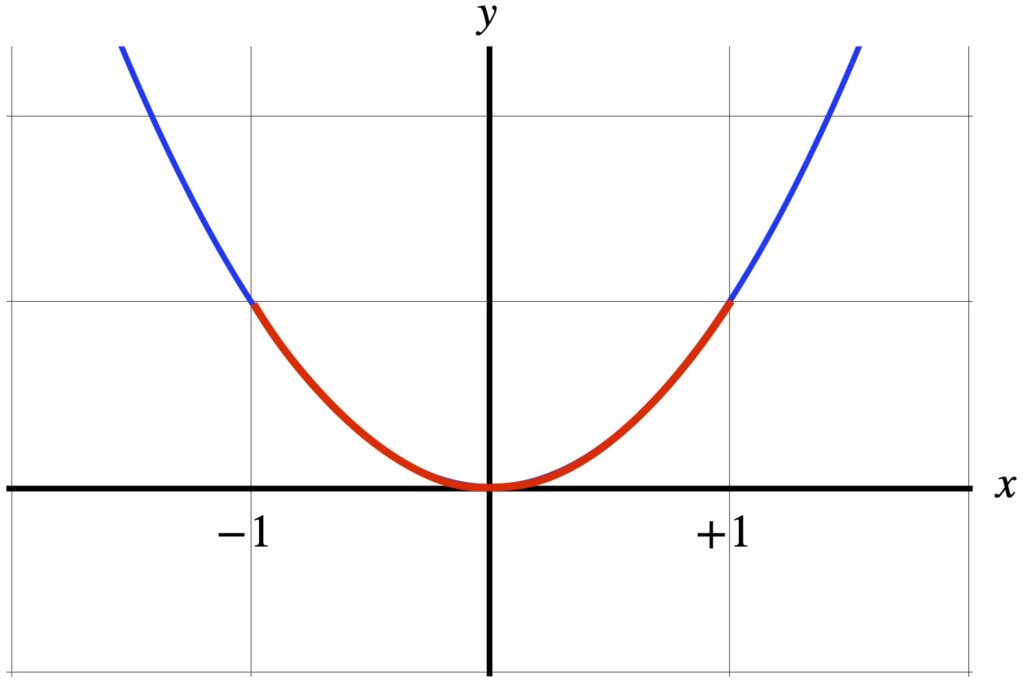
As an example, let’s calculate the length along the parabola pictured in figure 1.1.2.1, from x = -1 to x = +1.
The equation for this parabola is:
![]()
![]()
Our line element is:
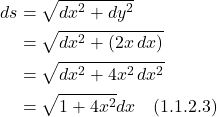
The integral we need to solve is:
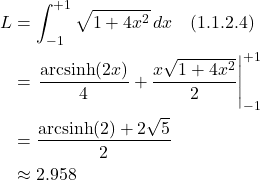
(The integral is hairy. I used an online calculator to find the answer.)
I.2 Line Integral of a Scalar Function
I.2.1 Derivation
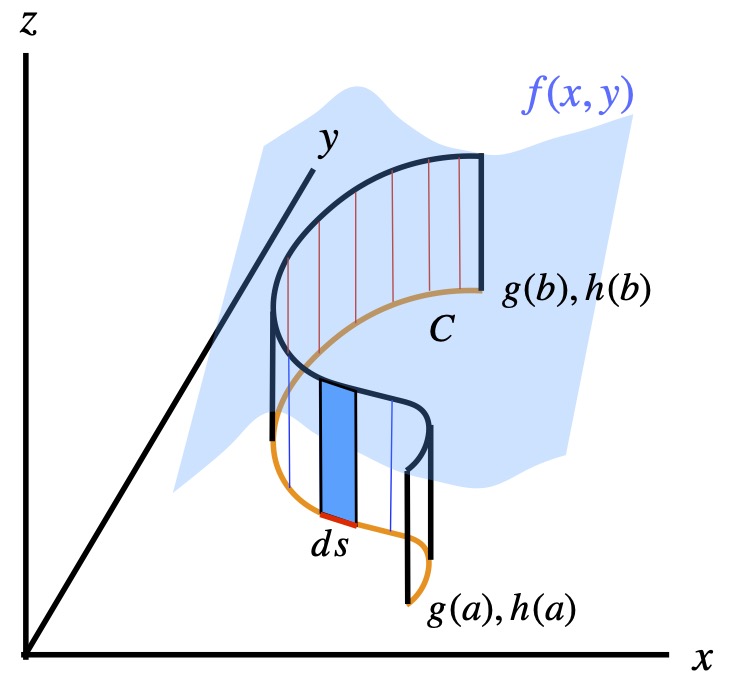
In figure 1.2.1.1, we have a curve C, in orange, in the x-y plane. We also have a surface, shown in light blue specified by a function of x and y, f(x,y). We run lines, along the entire course of C, in the +z direction from C to the blue surface, forming a “curtain” of sorts. We want to find the area of the curtain.
To do this, we divide the curtain up into narrow rectangles, find the area of these rectangles, add up all these areas, and we should have the area of the curtain. The base of these narrow rectangles, along the curve C, is ds. The height of each rectangle is f(x,y). The area of each rectangle is given by ![]() . If we take the limit of the sum of all these areas as
. If we take the limit of the sum of all these areas as ![]() , we wind up with an integral that gives us the area of the curtain:
, we wind up with an integral that gives us the area of the curtain:
![]()
To solve this integral, we:
- Find an expression for the differential length element,
 , along
- Parameterize the curve C (i.e., express
 and
and  in terms of another variable (parameter),
- Express the endpoints of
 in terms of
  to define the limits of integration
By the Pythagorean theorem, the length of the differential length element is:
![]()
To parameterize ![]() , we let:
, we let:
![]()
![]()
We define the endpoints of ![]() as
as ![]() and
and ![]() , as shown in figure 2.
, as shown in figure 2.
Figure 1.2
From this, our integral becomes:
![]()
But our integral contains x’s, y’s and t’s. We need to get everything in terms of one variable so we do the following:
First, let:
![]()
Second:
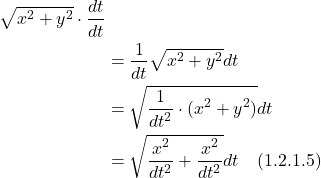
Putting these values into our integral, we get:
![]()
This is the integral we need to solve to get our area.
I.2.2 Example
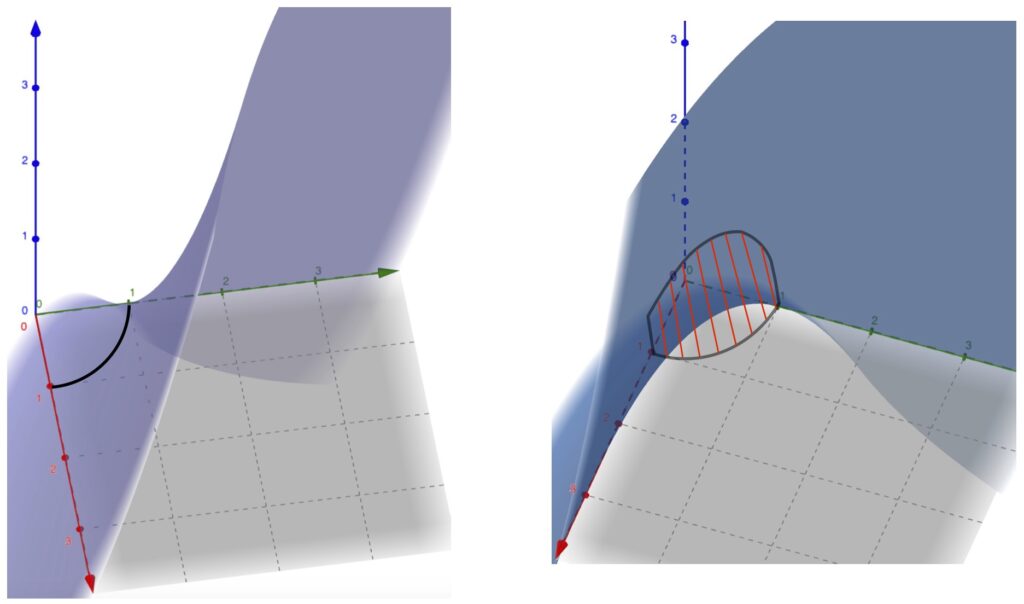
Figure 1.2.2.1 shows a surface specified by ![]() in 2 projections. (They’re different colors simply due to technical problems making them the same.) The black curve on the lefthand picture is the curve that we’re going to use for our line integral (we called it C in the derivation section). It’s a quarter of a circle. The diagram on the right shows the area we’re trying to calculate as red lines forming a “curtain,” extending from the quarter circle to the blue surface.
in 2 projections. (They’re different colors simply due to technical problems making them the same.) The black curve on the lefthand picture is the curve that we’re going to use for our line integral (we called it C in the derivation section). It’s a quarter of a circle. The diagram on the right shows the area we’re trying to calculate as red lines forming a “curtain,” extending from the quarter circle to the blue surface.
The equations that describe this problem are:
![]()
![]()
![Rendered by QuickLaTeX.com \[ds = \sqrt{\displaystyle \left(\frac{dx}{dt}\right)^2 + \left(\frac{dy}{dt}\right)^2}\,dt \quad \text{(1.2.2.3)} \]](https://www.samartigliere.com/wp-content/ql-cache/quicklatex.com-fa613303c0b5c47491a239d65591c4c4_l3.png)
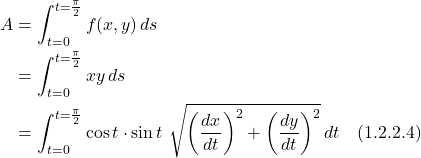
![]()
Therefore:

Let:
![]()
![]()
![]()
![]()
So:
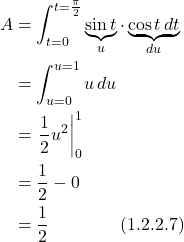
Note that it doesn’t matter in which direction along curve C we take to calculate the line integral. This makes intuitive sense since scalar values at each segment along the curve are the same whether you’re “going” or “coming.” A more formal proof of this (from Khan Academy) can be found here.
I.3 Line Integral of a Vector Field
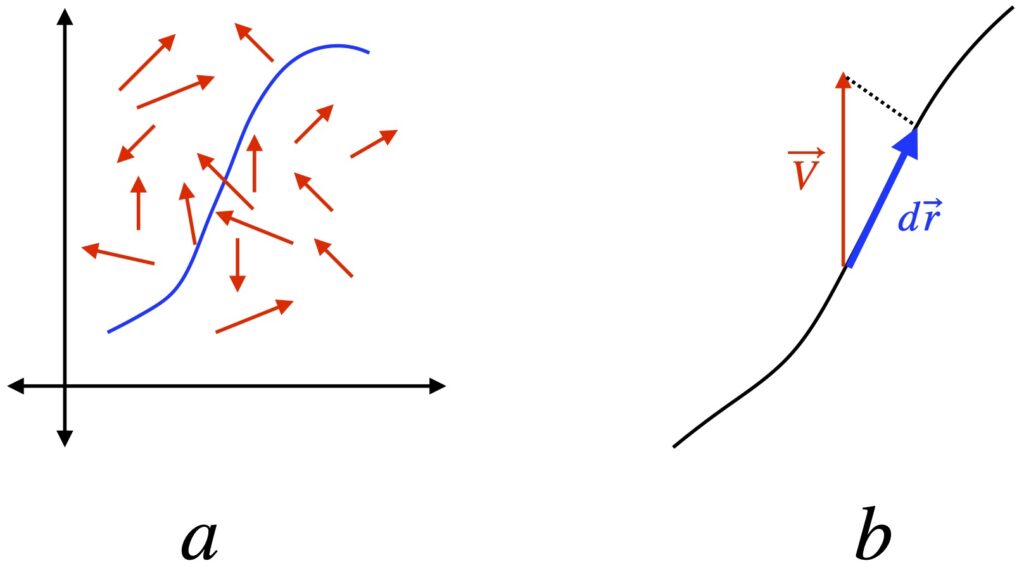
Figure 1.3.1a shows a curve, C, in blue, and a vector field with force vectors of varying directions and magnitude (shown in red). Our goal is to find the work done on a particle traversing the path specified by C. We know from classical physics that work = force x distance. Thus, to find the total work, we divide up C into tiny increments, ![]() . We find the component of the force field pointing in the direction of
. We find the component of the force field pointing in the direction of ![]() , given by the dot product (as shown by figure 1.3.1b). Then we sum all the force components at each of the infinitesimal lengths along C. Mathematically, this can be described as follows:
, given by the dot product (as shown by figure 1.3.1b). Then we sum all the force components at each of the infinitesimal lengths along C. Mathematically, this can be described as follows:
Force vector field: ![]() where P and Q are functions of x and y.
where P and Q are functions of x and y.
Displacement vectors along C: ![]() where
where ![]() .
.
Total work: ![]()
![]()
![]()
So,

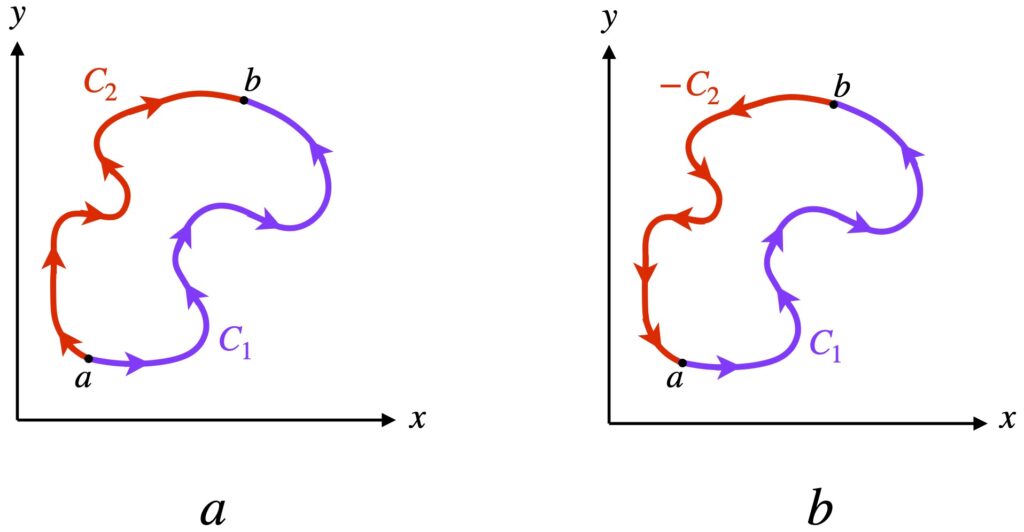
Note that it makes a difference which way one traverses the curve C to make the calculation of the line integral in a vector field. This makes sense since, in contrast to scalar values, vector values have a direction as well as a magnitude. Thus, since we’re pointing in different directions when we take different paths, the angle between ![]() and
and ![]() at each infinitesimal segment (which determines the dot product) is bound to be different. Furthermore, the line integral in the positive direction along curve C equals the negative of the line integral we get when we traverse curve C in the opposite direction. A formal proof of this, presented in a Khan Academy video, can be found by clicking here.
at each infinitesimal segment (which determines the dot product) is bound to be different. Furthermore, the line integral in the positive direction along curve C equals the negative of the line integral we get when we traverse curve C in the opposite direction. A formal proof of this, presented in a Khan Academy video, can be found by clicking here.
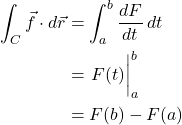
The exception is if our vector field is the gradient of a scalar field. Such a scalar field is referred to as a potential. The resulting vector field (i.e., the gradient of a potential) is called a conservative field. In this case, the value of a line integral going from point a to point b is independent of the path taken. This is the case for the electric force and gravitational force – both vector fields – that are defined as the gradients of potential energy fields (which are scalar fields). A proof of this can be found at Khan Academy and can be accessed by clicking here. The following is a quick recap of that .
A final point I should make before leaving this section is that if one traverses a closed curve in a conservative field (i.e., a field formed by the gradient of a scalar field), then the value of the line integral obtained as one traverses the closed loop is zero. This fact has ramifications in physics. To see a proof of this, click .
II. Surface Integrals
II.1 Derivation
Our goal in this section is to find the area of a surface in 3D space.
The equation for this surface is:
![]()
where the points at the end of ![]() are actually what define the surface, as shown in figure 2.1.1.
are actually what define the surface, as shown in figure 2.1.1.
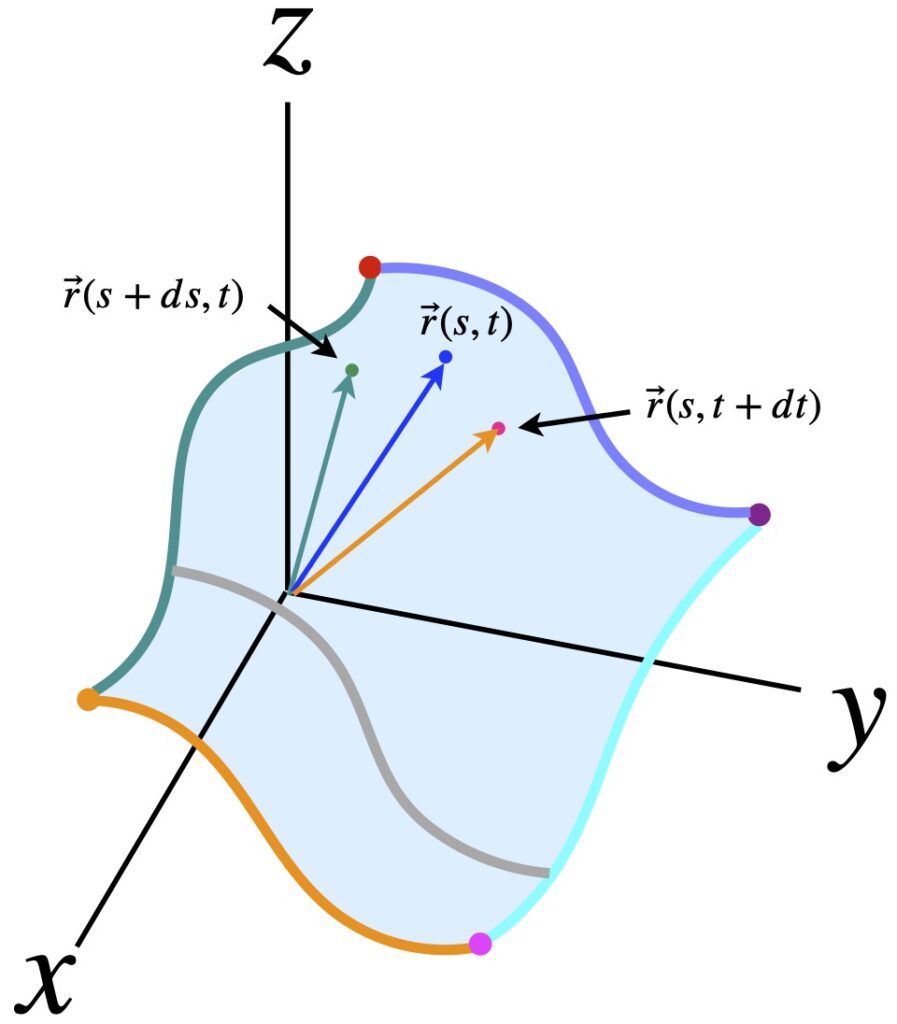

We can do the same for ![]() , namely:
, namely:
![]()
From the above, we can come up with the following 2 equations:
![]()
![]()
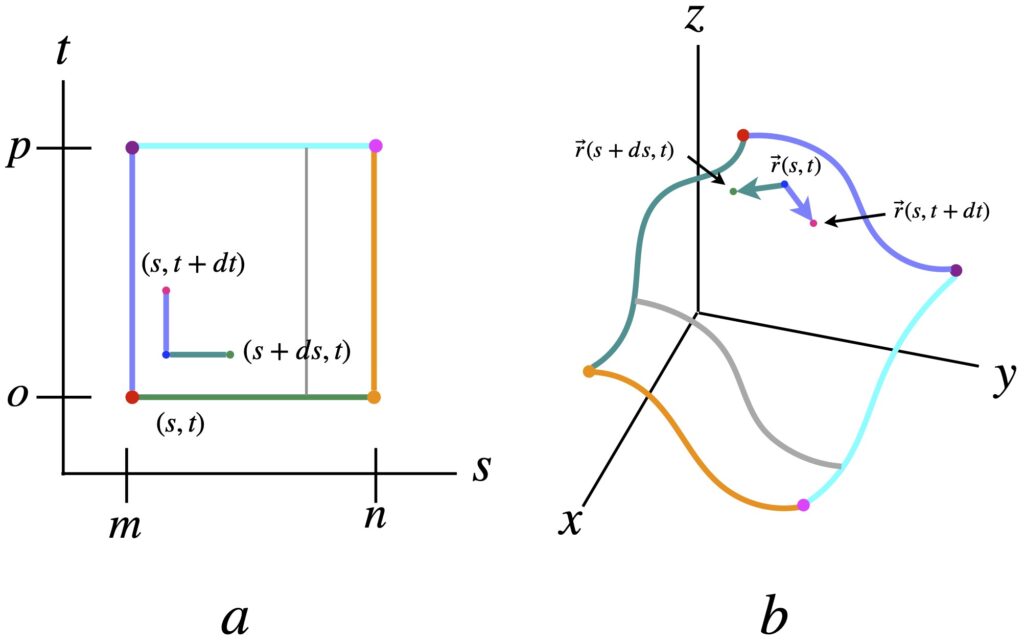
Figure 2.1.2a shows a graph of the parameters ![]() and
and ![]() . Points on this graph are mapped to the 3D surface shown in figure 2.1.2b. All the point along the green line in figure 2.1.2a map to the wavy green line in figure 2.1.2b. Similarly, the orange line in (a) maps to the wavy orange line in (b); the point
. Points on this graph are mapped to the 3D surface shown in figure 2.1.2b. All the point along the green line in figure 2.1.2a map to the wavy green line in figure 2.1.2b. Similarly, the orange line in (a) maps to the wavy orange line in (b); the point ![]() in (a) maps to
in (a) maps to ![]() in (b); the point
in (b); the point ![]() in (a) maps to
in (a) maps to ![]() in (b); and so forth.
in (b); and so forth.
In figure 2.1.2b, we can see that the small green vector, ![]() is just vector
is just vector ![]() subtracted from vector
subtracted from vector ![]() . But in eq. (2.1.5), we defined this quantity as
. But in eq. (2.1.5), we defined this quantity as ![]() .
.
Likewise, in figure 2.1.2b, the small purple vector, ![]() , is just
, is just ![]() subtracted from vector
subtracted from vector ![]() . But in eq. (2.1.6), we defined this quantity as
. But in eq. (2.1.6), we defined this quantity as ![]() .
.
Next we take the cross product of the small green and purple vectors. It’s known that, if we draw copies of the green and purple vectors end to tail with the existing green and purple vectors, they form a parallelogram, the area of which forms an infinitesimal area element which we’ll call ![]() . If we take the sum of all these infinitesimal area segments, we’ll get the total area of the surface (which is what we seek to find). And it turns out that the magnitude of the cross product of the small green and purple vectors equals that area of the infinitesimal area elements. Thus, we have an expression for
. If we take the sum of all these infinitesimal area segments, we’ll get the total area of the surface (which is what we seek to find). And it turns out that the magnitude of the cross product of the small green and purple vectors equals that area of the infinitesimal area elements. Thus, we have an expression for ![]() that we can use to calculate the area. Specifically:
that we can use to calculate the area. Specifically:

The total area of the surface, then, is given by:
![Rendered by QuickLaTeX.com \[ \underset{\Sigma}{\int \int } d\sigma = \bigg| \displaystyle \frac{\partial \vec{r} }{\partial s} \times \displaystyle \frac{\partial \vec{r} }{\partial t}\bigg|\, ds\,dt \quad \text{(2.1.8)} \]](https://www.samartigliere.com/wp-content/ql-cache/quicklatex.com-21f703ddbaa7819d5008477dc3a7391f_l3.png)
where ![]() means “take the integral over the entire surface.”
means “take the integral over the entire surface.”
II.2 Examples
II.2.1 Surface Area of a Sphere
The goal in this example is to obtain the surface area of a sphere by using the surface integral method. Other methods are certainly easier but we use the surface integral method here to prove see how the method works.
We’re trying to find  for the surface of a sphere as described by
 ![]() .
.
We parameterize the x, y and z as shown in figure 2.2.1.1.
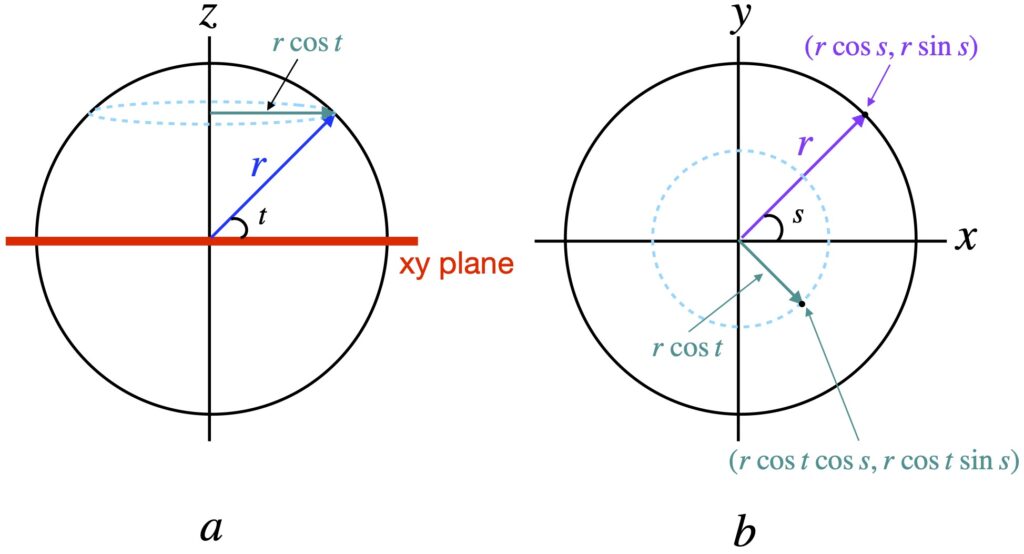
Figure 2.2.1.1a is a view of the sphere from the side. Figure 2.2.1.1b is a view of the sphere from the top.In (a), the xy plane goes in and out of the screen and is depicted as a thick red line. The sphere is described by 2 angles: 1) ![]() , the angle made with the x-axis in the xy plane and 2)
, the angle made with the x-axis in the xy plane and 2) ![]() , the angle made with the x-axis in the xz plane. The radius of the sphere is
, the angle made with the x-axis in the xz plane. The radius of the sphere is ![]() . In (b), the purple vector has length
. In (b), the purple vector has length ![]() is given by
is given by ![]() at
at ![]() (i.e., along the “equator” of the sphere). However, if we were to take a horizontal cross section of the sphere at other levels, the radius of the resulting circle would be less than
(i.e., along the “equator” of the sphere). However, if we were to take a horizontal cross section of the sphere at other levels, the radius of the resulting circle would be less than ![]() . Specifically, it would be
. Specifically, it would be ![]() , as shown in (a). The teal-colored broken circles depict such a “nonequatorial” circle. Finding the vector that specifies a point on the sphere’s surface on such circles helps us write a general expression for any point on the sphere (shown in green in (b)):
, as shown in (a). The teal-colored broken circles depict such a “nonequatorial” circle. Finding the vector that specifies a point on the sphere’s surface on such circles helps us write a general expression for any point on the sphere (shown in green in (b)):
![]()
The partial derivatives of ![]() needed to calculate the cross product required to define
needed to calculate the cross product required to define ![]() are:
are:
![]()
and
![]()
The cross product between these 2 vectors is:
![Rendered by QuickLaTeX.com \begin{align*} \frac{\partial \vec{r}}{\partial s} \times \frac{\partial \vec{r}}{\partial t} &= \begin{vmatrix} i & j & k \\ -r\cos (t)\sin(s) & r\cos(t)\cos(s) & 0 \\ -r\sin(t)\cos(s)& r\sin(t)\sin(s) & r\cos(t)\end{vmatrix} \\ \\ &= \begin{bmatrix} (r^2\cos^2 (t) \cos (s))\, \hat{i} \\ (r^2\cos^2( t )\sin (s))\, \hat{j} \\ (r^2 \cos (t) \sin( t) \sin^2 (s )+ r^2 \cos( t) \sin (t) \cos^2 (s))\, \hat{z} \end{bmatrix} \\ \\ &= \begin{bmatrix} (r^2\cos^2 (t) \cos (s))\, \hat{i} \\ (r^2\cos^2( t )\sin (s))\, \hat{j} \\ (r^2 \cos (t) \sin( t)[ \sin^2 (s ) + \cos^2 (s)])\, \hat{z} \end{bmatrix} \\ \\ &= \begin{bmatrix} (r^2\cos^2 (t) \cos (s))\, \hat{i} \\ (r^2\cos^2( t )\sin (s))\, \hat{j} \\ (r^2 \cos (t) \sin( t))\, \hat{z} \end{bmatrix} \quad \text{(2.2.1.4)} \end{align*}](https://www.samartigliere.com/wp-content/ql-cache/quicklatex.com-74a4cbbd456d225661a8b90c8c545b2e_l3.png)
Next, we need to find the magnitude of the cross product. The cross product is a vector. To find its magnitude, we take the dot product of the cross product with itself. We get:
![Rendered by QuickLaTeX.com \begin{align*} \bigg| \frac{\partial \vec{r}}{\partial s} \times \frac{\partial \vec{r}}{\partial t} \bigg| &= \sqrt{r^4\cos^4(t)\cos^2(s) + r^4\cos^4(t)\sin^2(s) + r^4\cos^2(t)\sin^2(t) } \\ \\ &= \sqrt{r^4[\cos^4(t)(\underbrace{\cos^2(s) + \sin^2(s)}_{1}) + \cos^2(t)\sin^2(t) ]} \\ \\ &= \sqrt{r^4[\cos^4(t) + \cos^2(t)\sin^2(t) ]} \\ \\ &= r^4\cos^(t)(\underbrace{\cos^2(t) + \sin^2(t)}_{1}) \\ \\ &= \sqrt{r^4\cos^2(t)} \\ \\ &= r^2\cos(t) \quad \quad \quad \quad \quad \text{(2.2.1.5)} \end{align*}](https://www.samartigliere.com/wp-content/ql-cache/quicklatex.com-264c2b93ba3f4274a92dfa80c53525bd_l3.png)
To find the area, we substitute this value into the integral of eq. (2.1.8):
![Rendered by QuickLaTeX.com \begin{align*} A = \underset{\Sigma}{\int \int } d\sigma &= \bigg| \displaystyle \frac{\partial \vec{r} }{\partial s} \times \displaystyle \frac{\partial \vec{r} }{\partial t}\bigg|\, ds\,dt \\ \\ &= \underset{\Sigma}{\int \int } r^2\cos(t)\,ds\,dt \\ \\ &= \int_0^{2\pi} ds \int_{-\frac{\pi}{2}}^{\frac{\pi}{2}} r^2\cos(t)\,dt \\ \\ &= 2 \pi r^2 \int_{-\frac{\pi}{2}}^{\frac{\pi}{2}} \cos(t)\,dt \\ \\ &= 2 \pi r^2 \eval{\sin(t)} _{-\frac{\pi}{2}}^{\frac{\pi}{2}} \\ \\ &= 2 \pi r^2[1-(-1)] \\ \\ &= 4 \pi r^2 \quad \quad \quad \quad \quad \text{(2.2.1.6)} \end{align*}](https://www.samartigliere.com/wp-content/ql-cache/quicklatex.com-bf9e0f44ff795d67e2d589c7da8e0e3f_l3.png)
which we know is the correct answer.
II.2.2 Surface Integral of a Scalar Field
We can take the surface integral of a scalar field by summing the value of the scalar field at each infinitesimal area element:
![Rendered by QuickLaTeX.com \[ \underset{\Sigma}{\int \int } F\,d\sigma \quad \text{(2.2.2.1)} \]](https://www.samartigliere.com/wp-content/ql-cache/quicklatex.com-d53392187a8f0b4b091dd4aa56b73c7b_l3.png)
For example, we can find the surface integral of a scalar field ![]() over a unit sphere as follows:
over a unit sphere as follows:
![Rendered by QuickLaTeX.com \[ \underset{\Sigma}{\int \int } x^2 d\sigma \quad \text{(2.2.2.2)} \]](https://www.samartigliere.com/wp-content/ql-cache/quicklatex.com-3fe4184639cf2e7df6a6c5e1b94b2f06_l3.png)
Our first step is to express our function in terms of our parameters ![]() and
and ![]() as given in eq. (2.2.1.1):
as given in eq. (2.2.1.1):
![]()
so
![]()
We plug this and the value for ![]() from eq. (2.2.1.5) into eq. (2.2.2.2), remembering that, since we’re dealing with a unit sphere,
from eq. (2.2.1.5) into eq. (2.2.2.2), remembering that, since we’re dealing with a unit sphere, ![]() :
:
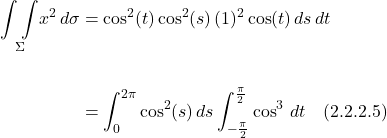
We’ll solve each integral separately then put them back together.
![]()
We use the trig identity:
![]()
Our integral becomes:
![]()
![]()
![Rendered by QuickLaTeX.com \[ \int_{-\frac{\pi}{2}}^{\frac{\pi}{2}} \cos^3\,dt \]](https://www.samartigliere.com/wp-content/ql-cache/quicklatex.com-5dbbdd00b16196f599993fef1991fd8f_l3.png)

Let

So we have:
![Rendered by QuickLaTeX.com \[ \int_{-\frac{\pi}{2}}^{\frac{\pi}{2}} [\cos(t) - \cos(t)\sin^2(t)]\,dt \]](https://www.samartigliere.com/wp-content/ql-cache/quicklatex.com-b13941b17813e3ceda0e1d59dbe75560_l3.png)
![Rendered by QuickLaTeX.com \[ \int_{-\frac{\pi}{2}}^{\frac{\pi}{2}} \cos(t)\,dt - \int_{-1}^1 u^2\,\cancel{\cos(t)}\cdot\frac{du}{\cancel{\cos(t)}} \]](https://www.samartigliere.com/wp-content/ql-cache/quicklatex.com-de0d9d4dbbc4334af19ace08e0a6ad3e_l3.png)
![Rendered by QuickLaTeX.com \[\eval{\sin(t)}_{-\frac{\pi}{2}}^{\frac{\pi}{2}} - \eval{\frac{u^3}{3}}_{-1}^1\]](https://www.samartigliere.com/wp-content/ql-cache/quicklatex.com-865f11a4d6fc634b3990323aa7afcc0c_l3.png)
![]()
Thus,

III. 3D Flux
III.1 Derivation
Say we have a vector field that represents flowing fluid. The density of the fluid (which is a scalar) is a function of space: ![]() . The velocity of the fluid (which is a vector) is also a function of space:
. The velocity of the fluid (which is a vector) is also a function of space: ![]() . They make up a function,
. They make up a function, ![]() where:
where:
![]()
Our goal is to determine the mass of fluid per unit time (i.e. flux) that flows through a surface ![]() per unit time. For convenience, we’ll use the same surface as we used in figure 2.1.2. As you may recall, that surface was parameterized by variables
per unit time. For convenience, we’ll use the same surface as we used in figure 2.1.2. As you may recall, that surface was parameterized by variables ![]() and
and ![]() .
.

The strategy for finding the flux is divide up our surface into infinitesimal surface area elements, find the flux through each elements and add up all these fluxes. That should give us the total flux.
Notice the units of ![]() :
: ![]()
where
![]() = mass
= mass
![]() = length
= length
![]() = time
= time
From this, we can see that if we multiply ![]() by an entity with units of
by an entity with units of ![]() , we will get an answer with units
, we will get an answer with units ![]() , which is what we want. Of course, area has units of
, which is what we want. Of course, area has units of ![]() . Thus, it makes sense that we might multiply
. Thus, it makes sense that we might multiply ![]() at each infinitesimal surface element by the area of that element and take their sum (i.e., take their integral). But there’s one more piece of the puzzle. The fluid is flowing in all directions. To get a proper answer, for each infinitesimal element we’re summing, we need to consider only the components of
at each infinitesimal surface element by the area of that element and take their sum (i.e., take their integral). But there’s one more piece of the puzzle. The fluid is flowing in all directions. To get a proper answer, for each infinitesimal element we’re summing, we need to consider only the components of ![]() that are perpendicular (normal) to our surface elements.
that are perpendicular (normal) to our surface elements.
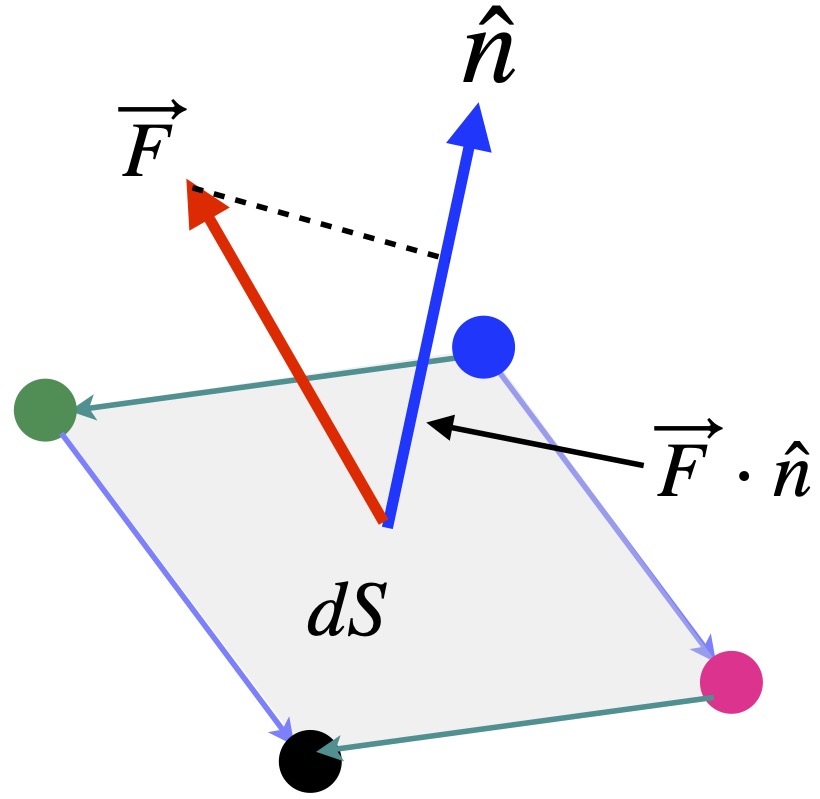
To do this, we can take the dot product of ![]() with a unit vector perpendicular to our surface at each infinitesimal element, multiply this quantity by the infinitesimal area at that site and sum up all the infinitesimal elements (i.e., take their integral). Thus, the expression we need to evaluate to find the total flux through the surface is:
with a unit vector perpendicular to our surface at each infinitesimal element, multiply this quantity by the infinitesimal area at that site and sum up all the infinitesimal elements (i.e., take their integral). Thus, the expression we need to evaluate to find the total flux through the surface is:
![Rendered by QuickLaTeX.com \[ \text{Flux} = \underset{S}{\int \int } \vec{F}\cdot\hat{n}\cdot dS \quad \text{(3.1.2)} \]](https://www.samartigliere.com/wp-content/ql-cache/quicklatex.com-c26e28bdffd3840d95bae3c9aa9d51ba_l3.png)
where
![]() is the vector field defined above
is the vector field defined above
![]() is an infinitesimal surface element (a scalar)
is an infinitesimal surface element (a scalar)
![]() is the unit vector perpendicular to
is the unit vector perpendicular to ![]()
The trick now is to find ![]() . In our derivation of the surface integral, we noted that the infinitesimal area element is given by eq. (2.1.7):
. In our derivation of the surface integral, we noted that the infinitesimal area element is given by eq. (2.1.7):

The vectors that make up this cross product are tangent to our surface, ![]() . We noted previously that the infinitesimal parallelogram formed by the vectors that make up the cross product and vectors parallel to them laid end to tail with them constitutes a tiny area element. What I want to stress here, however, is that the vectors that make up the cross product form a vector that points in a direction perpendicular to the infinitesimal parallelogram. Thus, the cross product constitutes a vector normal to our surface. Its magnitude, however, is equal to the parallelogram’s area, which isn’t necessarily 1 (i.e., it’s not necessarily a unit vector). To make it the unit normal vector we seek (i.e., a normal vector with a magnitude of 1), we need to divide the this vector by the magnitude of the cross product. Thus, we have:
. We noted previously that the infinitesimal parallelogram formed by the vectors that make up the cross product and vectors parallel to them laid end to tail with them constitutes a tiny area element. What I want to stress here, however, is that the vectors that make up the cross product form a vector that points in a direction perpendicular to the infinitesimal parallelogram. Thus, the cross product constitutes a vector normal to our surface. Its magnitude, however, is equal to the parallelogram’s area, which isn’t necessarily 1 (i.e., it’s not necessarily a unit vector). To make it the unit normal vector we seek (i.e., a normal vector with a magnitude of 1), we need to divide the this vector by the magnitude of the cross product. Thus, we have:
![Rendered by QuickLaTeX.com \[ \hat{n} = \displaystyle \frac{\displaystyle \frac{\partial \vec{r} }{\partial s} \times \displaystyle \frac{\partial \vec{r} }{\partial t}}{\bigg| \displaystyle \frac{\partial \vec{r} }{\partial s} \times \displaystyle \frac{\partial \vec{r} }{\partial t}\bigg|} \quad \text{(3.1.3)} \]](https://www.samartigliere.com/wp-content/ql-cache/quicklatex.com-7e82bdb9efc9e16bb8b045b66b2869f4_l3.png)
What we called ![]() in our derivation of the surface integral is represented by
in our derivation of the surface integral is represented by ![]() is our current problem. Therefore, our integral for the total flux becomes:
is our current problem. Therefore, our integral for the total flux becomes:
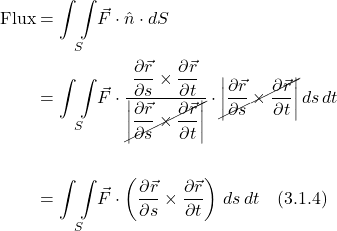
The flux integral is sometimes written as:
![Rendered by QuickLaTeX.com \[ \text{Flux} &= \underset{S}{\int \int } \vec{F}\cdot d\vec{S} \quad \text{(3.1.4)} \]](https://www.samartigliere.com/wp-content/ql-cache/quicklatex.com-cf405e0354b11db2770591472b36bd43_l3.png)
The rationale for this is as follows:

As Sal Khan points out in the video from which this derivation was taken, the math in this last step (canceling differential elements) is a bit “loosey-goosey.” However, it helps convey the intuition of why we can write things in this way. The vectors ![]() with which we create the cross product are what we called
with which we create the cross product are what we called ![]() and
and ![]() in our previous derivation. The magnitude of this cross product equals
in our previous derivation. The magnitude of this cross product equals ![]() , the scalar that appears in eq. 3.1.2. The cross product vector, itself, points in the direction normal to our surface.
, the scalar that appears in eq. 3.1.2. The cross product vector, itself, points in the direction normal to our surface.
In the end, what we’re saying here is, just as ![]() – a vector with, say magnitude 5 pointing in the x-direction equals
– a vector with, say magnitude 5 pointing in the x-direction equals ![]() :
:
![]()
III.2 Example
An example of a 3D flux problem can be found at Khan Academy.
IV. Green’s Theorem
IV.1 Derivation
In figure 4.1.1, we take 1) a closed curve, ![]() (pink and blue), and 2) a vector field
(pink and blue), and 2) a vector field ![]() (red arrows) that only points in the + or – x direction. We want to take the sum of
(red arrows) that only points in the + or – x direction. We want to take the sum of ![]() around the circumference of
around the circumference of ![]() .
.
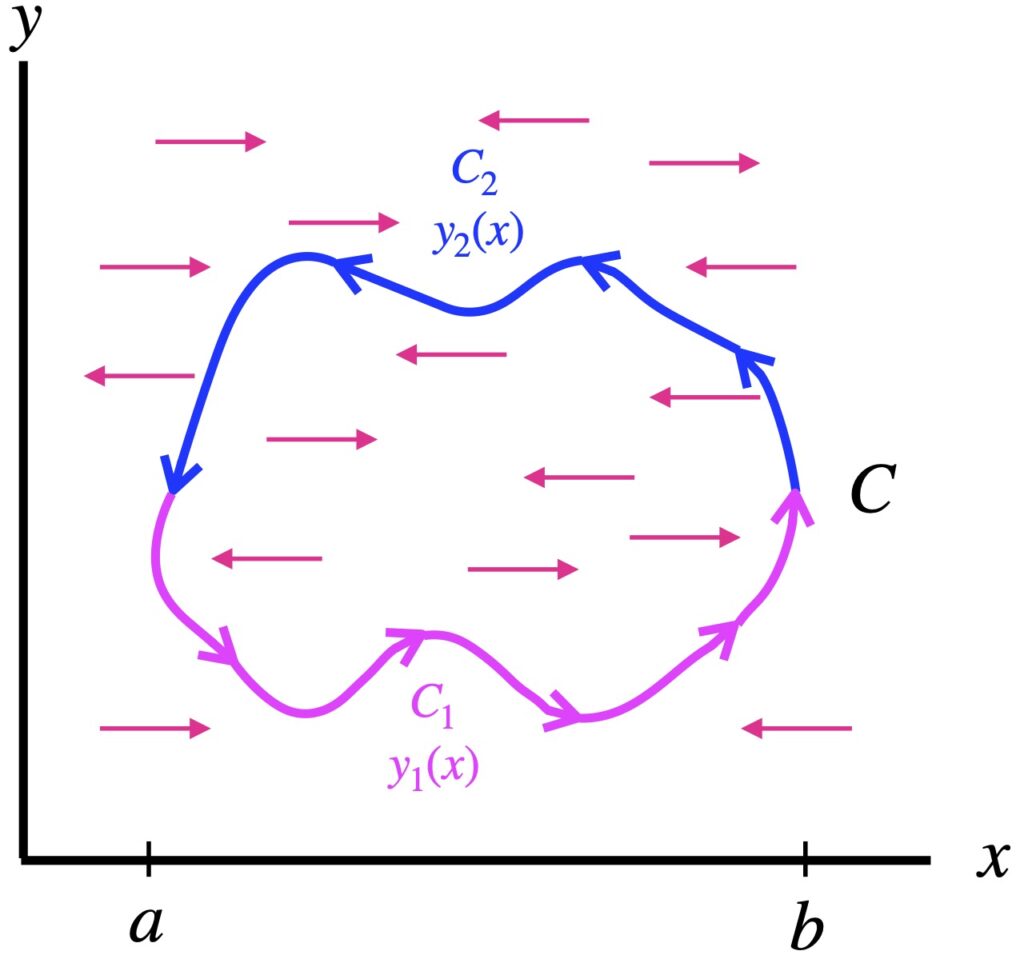
![]()
![]()
![Rendered by QuickLaTeX.com \begin{align*} \oint_C \vec{P} \cdot d\vec{r} &= \oint P(x,y)\,dx \\ \\ &= \underbrace{\int_a^b P(x,y_1(x))\,dx}_{C_1} + \underbrace{\int_b^a P(x,y_2(x))\,dx}_{C_2} \\ \\ &= \int_a^b \left[P(x,y_1(x)) -P(x,y_2(x)) \right]\,dx \\ \\ &= -\int_a^b \left[P(x,y_2(x))\,dx - P(x,y_1(x)) \right]\,dx \\ \\ &= -\int_a^b \underbrace{\eval{P(x,y)}_{y=y_1(x)}^{y=y_2(x)}}\,\,dx \\ \\ &= -\int_a^b \underbrace{\int_{y=y_1(x)}^{y=y_2(x)}\displaystyle \frac{\partial P}{\partial y}\,dy} \,\,dx \quad \text{(4.1.3)} \end{align*}](https://www.samartigliere.com/wp-content/ql-cache/quicklatex.com-1e4936fe2907e95d17286ea5c08460cf_l3.png)
Next, we take the same closed curve, ![]() , but this time, consider a vector field,
, but this time, consider a vector field, ![]() where
where ![]() only points in the + or – y direction. Again, we take
only points in the + or – y direction. Again, we take ![]() at each point around
at each point around ![]() and add them up (i.e., integrate them). We have:
and add them up (i.e., integrate them). We have:
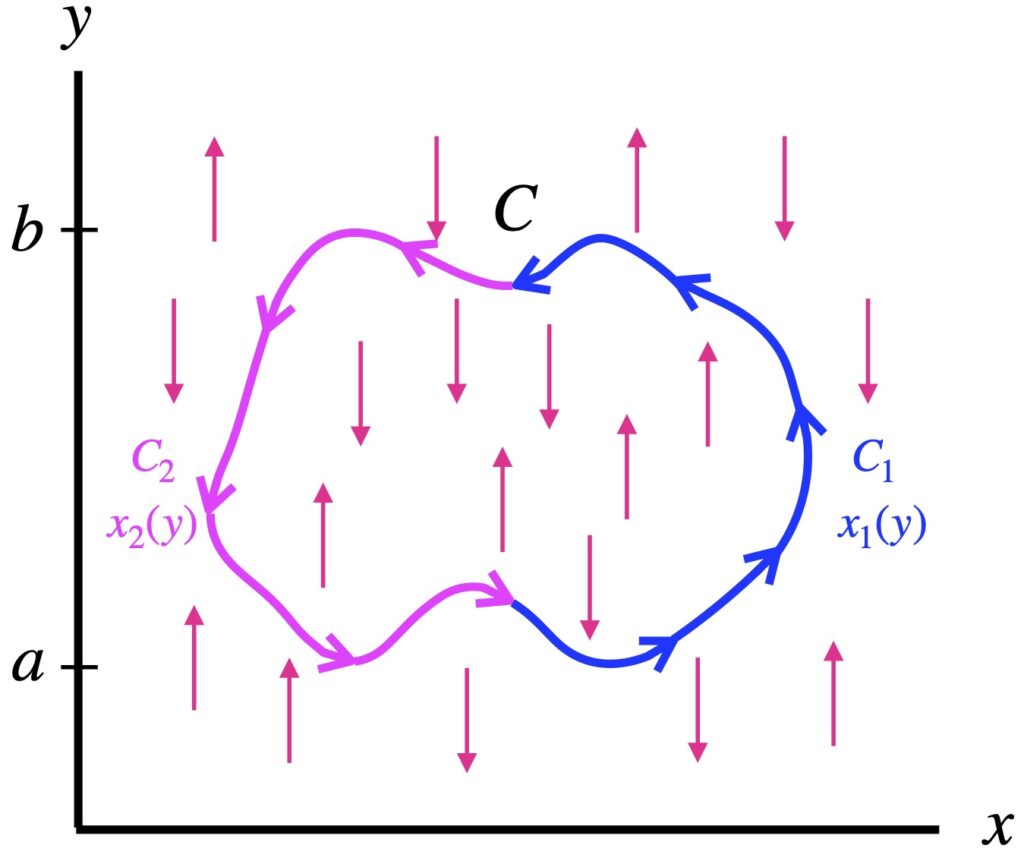
![]()
![]()
![Rendered by QuickLaTeX.com \begin{align*} \oint_C \vec{Q} \cdot d\vec{r} &= \oint Q(x,y)\,dy \\ \\ &= \underbrace{\int_a^b Q(x_1(y),y)\,dy}_{C_1} + \underbrace{\int_b^a Q(x_2(y),y)\,dy}_{C_2} \\ \\ &= \int_a^b \left[Q(x_1(y),y) -Q(x_2(y),y) \right]\,dy \\ \\ &= \int_a^b \left[Q(x_1(y),y)\,dy - Q(x_2(y),y) \right]\,dy \\ \\ &= \int_a^b \underbrace{\eval{Q(x,y)}_{x=x_2(y)}^{x=x_1(y)}}\,\,dy \\ \\ &= \int_a^b \underbrace{\int_{x=x_2(y)}^{x=x_1(x)}\displaystyle \frac{\partial Q}{\partial y}\,dx} \,\,dy \quad \text{(4.1.6)} \end{align*}](https://www.samartigliere.com/wp-content/ql-cache/quicklatex.com-8e3d25c444544d031594d6d8ee127737_l3.png)
Now suppose we have the same closed curve, ![]() , but our vector field points in all directions in the xy plane. We can put together the results we got it the first 2 parts of this derivation to obtain:
, but our vector field points in all directions in the xy plane. We can put together the results we got it the first 2 parts of this derivation to obtain:
![]()
![]()
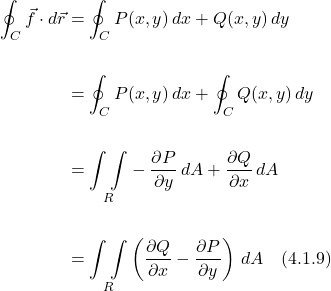
Eq. (4.1.9) is a statement of Green’s theorem.
You may recognize ![]() as the curl of
as the curl of ![]() . Thus, Green’s theorem can be interpreted as saying the tendency of a vector field to rotate along curve
. Thus, Green’s theorem can be interpreted as saying the tendency of a vector field to rotate along curve ![]() is equivalent to the tendency of the vector field to rotate within the area enclosed by
is equivalent to the tendency of the vector field to rotate within the area enclosed by ![]() .
.
Note that, to apply Green’s theorem, we have to have a piecewise smooth, simple, closed curve. If we traverse our curve in the clockwise direction, this is called a positively-oriented curve and we use the integrals we found in this derivation. If we traverse the curve in a clockwise direction, this is called a negatively-oriented curve and we have to take the negative of the integrals we derived.
IV.2 Examples
An example of the application of Green’s theorem can be found at Khan Academy by clicking here.
V. 2D Divergence Theorem
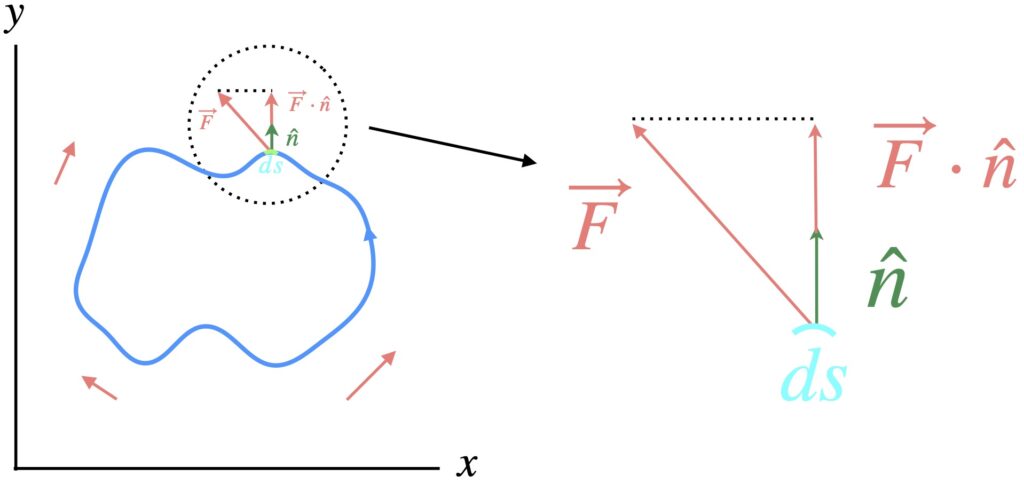
We can think of the divergence theorem as a 2D flux problem, although as we’ll see, when we apply Green’s theorem, we add an extra wrinkle.
In figure 5.1, we have a piecewise smooth, simple, positively-oriented, closed curve (shown in blue) and a vector field shown in light red. Similar to our 3D flux problem, let’s suppose our vector field represents a density of a fluid times a velocity:

We can get our outward flux with the integral:
![]()
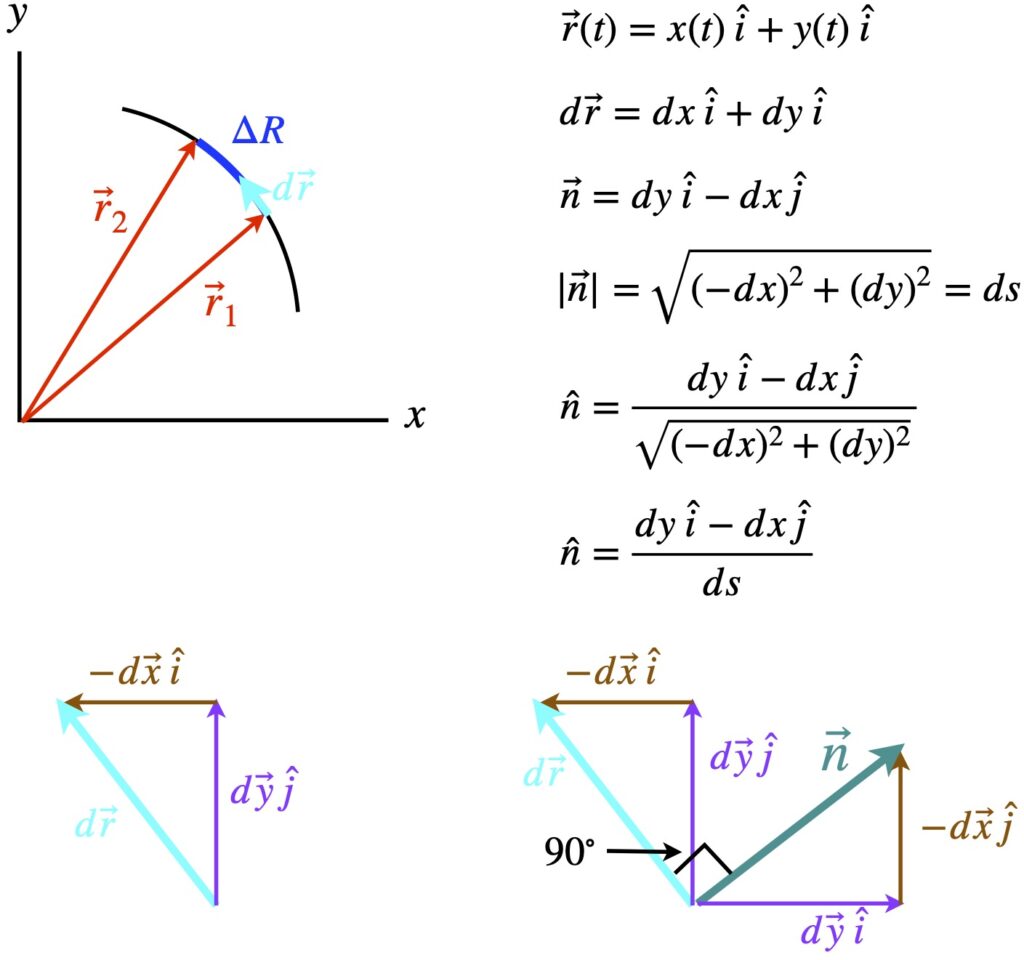
We can write our unit normal vector as:
![]()
To see how we get this, click .
Substituting eq. (5.3) into eq. (5.2), we get:
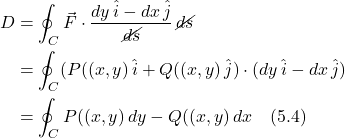
Now we apply Green’s theorem:
![Rendered by QuickLaTeX.com \begin{align*} D &= \oint_C P((x,y)\,dy - Q((x,y)\,dx = \underset{R}{\int \int } \left[\frac{\partial P}{\partial x} -(-\frac{\partial Q}{\partial y})\right] dA \\ &= \underset{R}{\int \int } \left[\underbrace{\frac{\partial P}{\partial x} + \frac{\partial Q}{\partial y}}_{\nabla \cdot \vec{F}}\right] dA \\ &= \underset{R}{\int \int } \text{div } \vec{F}\,dA \quad \text{(5.5)} \end{align*}](https://www.samartigliere.com/wp-content/ql-cache/quicklatex.com-34ba623195d1566fc0da74a8329b65bc_l3.png)
where div ![]() is the divergence of
is the divergence of ![]() .
.
Eq. (5) is a statement of the 2D divergence theorem.
VI. Stokes’ Theorem
VI.1 Intuition
This section on the intuition for Stokes’ theorem is taken from:
https://www.lehman.edu/faculty/anchordoqui/VC-4.pdf
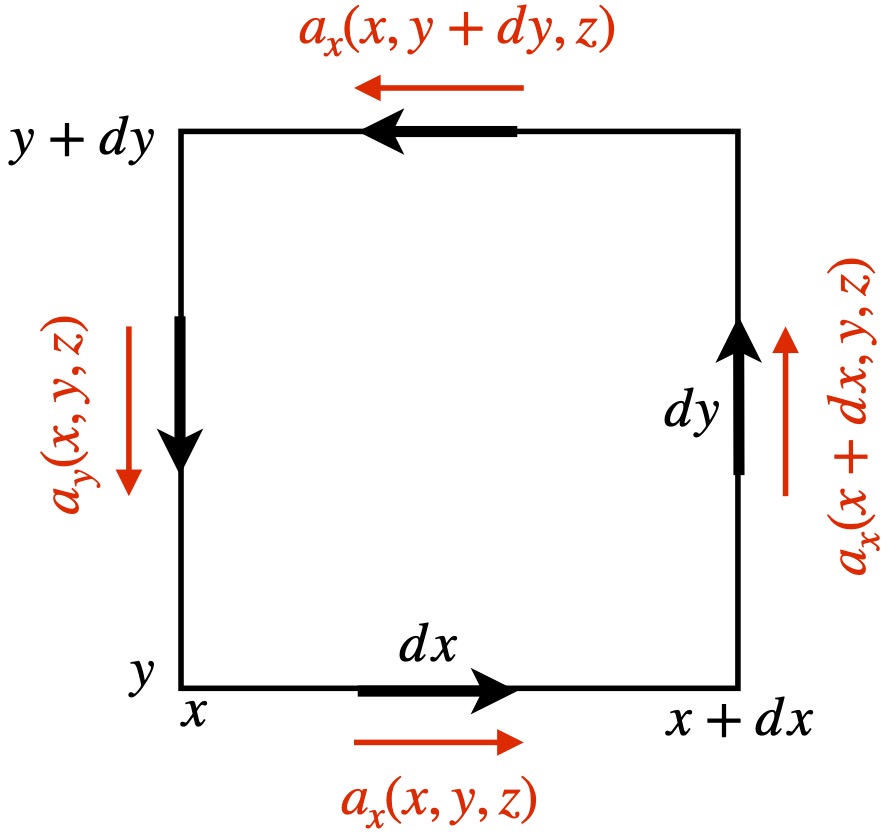
In figure 6.1.1, we have an infinitesimal area element, enclosed by a contour, ![]() , with sides given by
, with sides given by ![]() and
and ![]() (thick arrows), in a vector field
(thick arrows), in a vector field ![]() . The red vectors represent the components of of the vector field tangent to the contour enclosing the infinitesimal area element. The fields in the x direction, respectively, at the bottom and top are:
. The red vectors represent the components of of the vector field tangent to the contour enclosing the infinitesimal area element. The fields in the x direction, respectively, at the bottom and top are:
![]()
The fields in the y direction, respectively, on the left and right are:
![]()
We traverse our contour in the counterclockwise direction from the left bottom. We want to find the total amount of the field pointing in the direction in which we’re traversing the counter, that direction representing a circulating or “curling” motion. To do this, we take the dot product of our vector field at each small segment as we traverse the contour since this gives us the component of the field in the direction of our motion.
Since the length of each segment is small, we assume that the field is constant over that segment. The 4 segments of ![]() are as follows, where the minus sign correlates with segments in which we move in the -x and -y directions:
are as follows, where the minus sign correlates with segments in which we move in the -x and -y directions:
![Rendered by QuickLaTeX.com \begin{align*} dC &= +[a_x\,dx] +[a_y(x+dx,y,z)dy)\,dx] - [a_x(x,y+dy,z)\,dx] - [a_y\,dy] \\ &= +[a_x\,dx] +\left[\left( a_y + \frac{\partial a_y}{\partial x}dx \right)dy\right] - \left[\left( a_x + \frac{\partial a_x}{\partial y}dy \right)dx\right] - [a_y\,dy] \\ &= \cancel{a_x\,dx} + \cancel{a_y\,dy} + \frac{\partial a_y}{\partial x}dx \,dy -\cancel{a_x\,dx} - \frac{\partial a_x}{\partial y}dy\,dx - \cancel{a_y\,dy} \\ &= \left( \frac{\partial a_y}{\partial x} - \frac{\partial a_x}{\partial y} \right)\,dx\,dy \\ &= (\nabla \times \vec{a})\cdot d\vec{s} \quad \quad \quad \text{(6.1.3)} \end{align*}](https://www.samartigliere.com/wp-content/ql-cache/quicklatex.com-d25c7aac632c0e99aba078cee03aab39_l3.png)
where
![]()
So ![]() represents the how much our vector field circulates (or curls) around the curve enclosing any tiny surface. We recognize
represents the how much our vector field circulates (or curls) around the curve enclosing any tiny surface. We recognize ![]() as the curl of
as the curl of ![]() :
:
![]()
which we can think of as the tendency of a vector field to circulate or curl per unit area. In fact, the curl has been defined as the amount of circulation of a vector field around a closed curve as the area enclosed by the curve decreases toward 0 (i.e., shrinks down to a point). Mathematically, this is written as:
![]()
At any rate, consider – as shown if figure 6.1.2 – what happens if we add up the circulation (or curl) in all the small surface elements that make up a surface, ![]() .
.
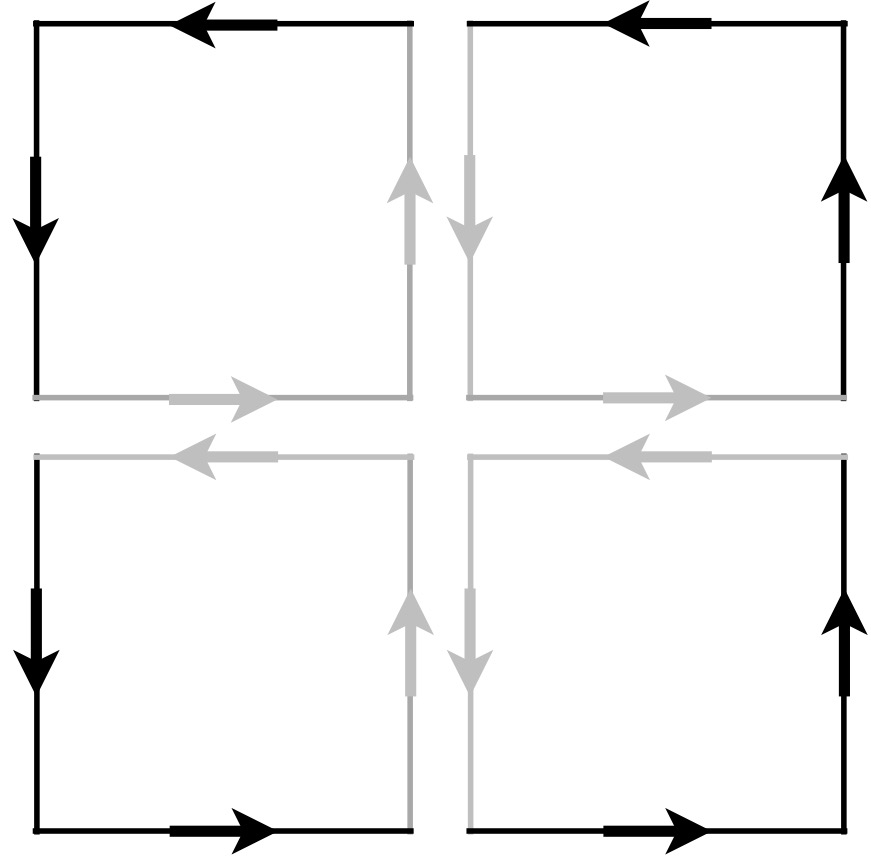
What happens is that the “internal” elements of curl (depicted in light gray) cancel each other while the elements tangent to the curve enclosing the surface add up.
We know that the total tendency to circulate (or curl) along a closed curve is given by:
![]()
But from the figure 6.1.2, it appears that the sum of the tendency to circulate (i.e. curl) within all the tiny area elements ![]() making up a surface
making up a surface ![]() is equivalent to the tendency to circulate along the enclosing curve:
is equivalent to the tendency to circulate along the enclosing curve:
![Rendered by QuickLaTeX.com \[ \int_C \vec{F} \cdot d\vec{s} = \underset{S}{\int \int } (\nabla \times \vec{F}) \cdot d\vec{s} \quad \text{(6.1.7)} \]](https://www.samartigliere.com/wp-content/ql-cache/quicklatex.com-040f8d681e71de7d7c0ce840fd2cc3b7_l3.png)
Eq. (6.1.7) is Stokes’ theorem. We’ll prove it by equating the left and right sides of this equation in the next section.
Before we leave this discussion, you might be wondering, What’s the difference between Stokes’ theorem and Green’s theorem? In fact, as shown in figure 6.1.3, Stokes’ theorem is the 3D generalization of Green’s theorem.
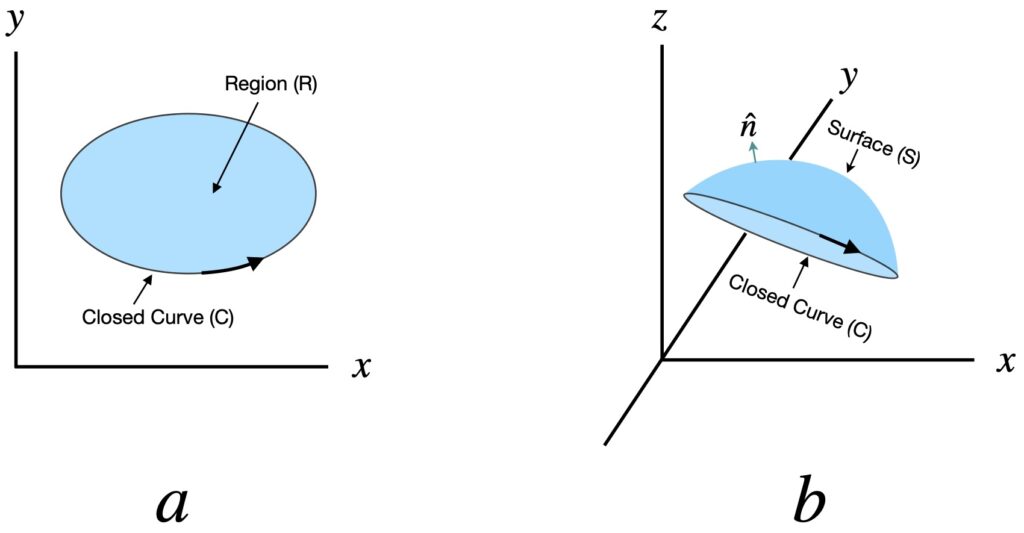
Or stated differently, Green’s theorem is a special case of Stoke’s theorem. As can be seen in the diagram, both the blue region ![]() in figure 6.1.3a, and the blue surface in figure 6.1.3b are areas; areas that, in both theorems, are determined by taking double integrals; areas that, in both theorems, are then equated to the line integral around the curve enclosing them. The difference is that, in Green’s theorem, the area is “flat” (i.e., confined to the xy plane) while in Stokes’ theorem, the surface can be “curved above or below the xy plane” (i.e. extended to 3D).
in figure 6.1.3a, and the blue surface in figure 6.1.3b are areas; areas that, in both theorems, are determined by taking double integrals; areas that, in both theorems, are then equated to the line integral around the curve enclosing them. The difference is that, in Green’s theorem, the area is “flat” (i.e., confined to the xy plane) while in Stokes’ theorem, the surface can be “curved above or below the xy plane” (i.e. extended to 3D).
VI.2 Proof
Now that we’ve got some intuition about Stoke’s theorem, we’ll prove it – as mentioned above – by proving that the two sides of eq. (6.1.7) are equal.
We start with a parameterized surface, ![]() , (a unit hemisphere with z > 0) as shown in figure 6.2.1.
, (a unit hemisphere with z > 0) as shown in figure 6.2.1.
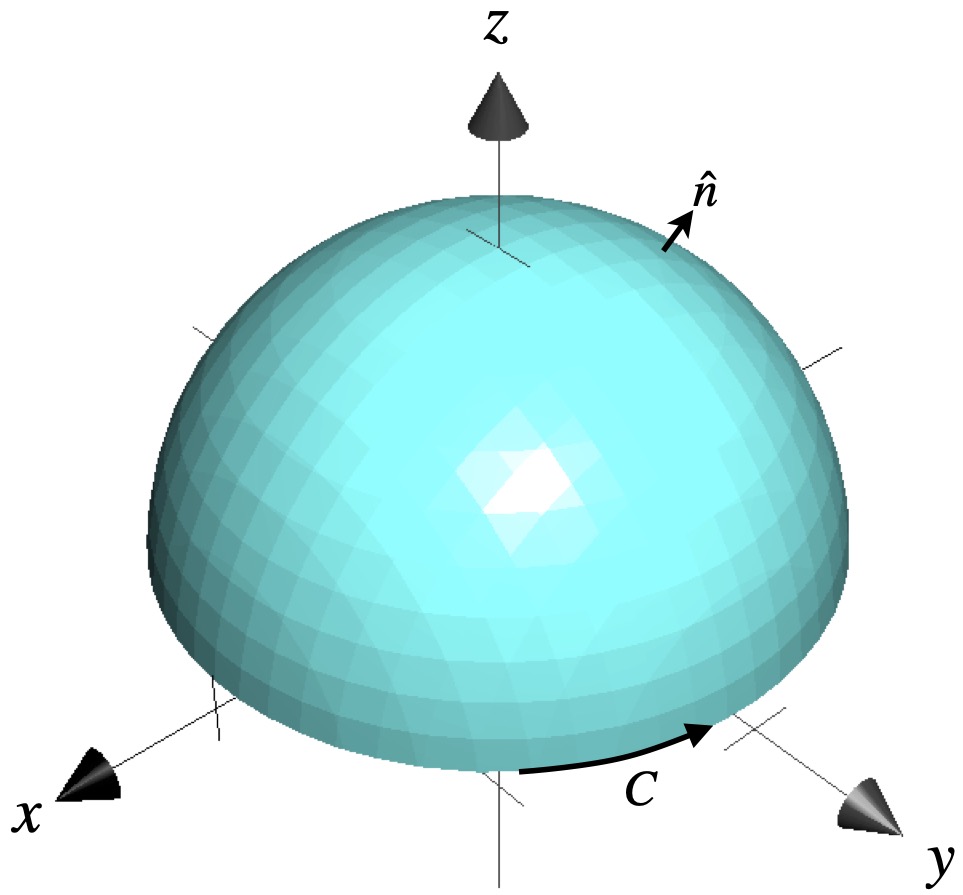
We traverse the closed curve , ![]() , of which we will take our line integral in the counterclockwise direction. That means, by the righthand rule, our normal vector,
, of which we will take our line integral in the counterclockwise direction. That means, by the righthand rule, our normal vector, ![]() , (the direction of our curl vector) will point outward*.
, (the direction of our curl vector) will point outward*.
*Another way to determine the direction of the normal vector is to image walking around our closed curve. When our left arm is on the side facing the inside of our surface, our head points in the direction of the normal vector. In figure 6.2.1, as we traverse our closed curve in the counterclockwise direction, our left arm is on the side of the interior of our surface and our head – the direction of our normal vector – points in the direction of the z-axis. We can think of the normal vector depicted in figure 6.2.1 as the result of translating that normal vector from the top of the hemisphere to the position where it’s shown, maintaining normality of the vector along the way.
A third way to determine the direction of the normal vector with respect to how we’re traversing our closed curve is to imagine twisting a bottle cap. The direction of twisting is analogous to the direction we’re traversing our closed curve. The result of that twist is the direction of the normal vector (e.g. twist counterclockwise with the bottle pointing up and the bottle cap moves upward, which is the direction of the normal vector; twist rightward and the cap moves down which, again, is the normal vector direction).
I’ve gone into detail about how to relate direction of traversing our curve and our normal vector because getting these directions right is CRITICAL.
The vector field we’re considering is:
![]()
The choice of our vector field and surface are completely arbitrary, thus the results of this proof should apply to any vector field and surface. We could have defined our vector field and surface with just abstract symbols but using concrete values makes visualization easier.
We’ll compute our line integral first. To do that, we need to parameterize our curve, which is the base of the sphere – a unit circle. We can parameterize it as:
![]()
![]()
![]()
![]()
![]()
![]()
![]()
![]()
To perform our line integral, we take the dot product of ![]() with
with ![]() . We have:
. We have:
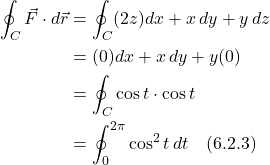
We use substitute the trig identity:
![]()
into eq. (6.2.3) to get:

Next, we turn our attention to solving the surface integral. Our formula is:
![Rendered by QuickLaTeX.com \[ \underset{S}{\int \int } \nabla \vec{F} \cdot \hat{n} \, dS \quad \text{(6.2.3)} \]](https://www.samartigliere.com/wp-content/ql-cache/quicklatex.com-e4c935c7ee53dbe5ee2e2880026c7ddd_l3.png)
![Rendered by QuickLaTeX.com \[ \nabla \vec{F} = \begin{vmatrix} i & j & k \\ \frac{\partial}{\partial x} &\frac{\partial}{\partial y} &\frac{\partial}{\partial z} \\ 2z & x & y \end{vmatrix} &= \begin{pmatrix} \frac{\partial}{\partial y}\,dy - \frac{\partial}{\partial z} \, x \\ -\left( \frac{\partial}{\partial x} \ y - \frac{\partial}{\partial z}\,2z\right) \\ \frac{\partial}{\partial x} \, x - \frac{\partial}{\partial y} \, z \end{pmatrix} = \begin{pmatrix} 1 \\ 2 \\ 1\end{pmatrix} =<1,2,1> \quad \text{(6.2.4)} \]](https://www.samartigliere.com/wp-content/ql-cache/quicklatex.com-fbeefec213bdad677a3f39b5a274281a_l3.png)
Now we turn our attention to finding our unit normal vector. In general, a unit normal vector can be found by taking the gradient of the function that specifies our surface and dividing by the length of vector that results from this operation.
![]()
The function describing our surface is:
![]()
So:
![]()
The magnitude of this normal vector is:
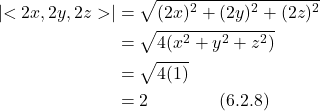
Therefore, our unit normal vector is:
![]()
Finally, we need to determine ![]() . We know the line element for a sphere is:
. We know the line element for a sphere is:
![]()
![]() is constant so
is constant so ![]() . The sides of the infinitesimal entities that make up infinitesimal area elements on the sphere’s surface are thus
. The sides of the infinitesimal entities that make up infinitesimal area elements on the sphere’s surface are thus ![]() and
and ![]() . Therefore, the infinitesimal area element on the surface of a sphere is:
. Therefore, the infinitesimal area element on the surface of a sphere is:
![]()
But we’re dealing with a unit hemisphere where ![]() . Therefore:
. Therefore:
![]()
Recapping:
![]()
![]()
![]()
We need to convert x, y and z to polar coordinates. The conversions are:
![]()
![]()
![]()
![]()
![]()
Putting this all together, we have:
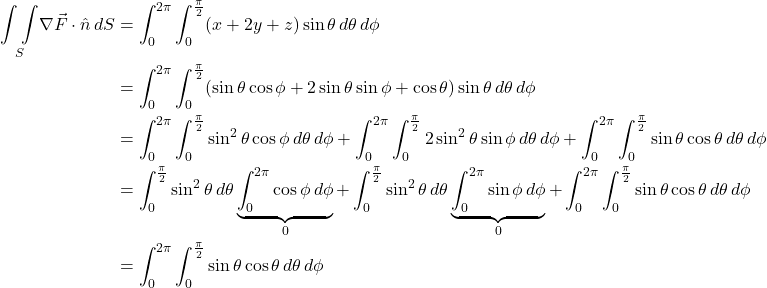
Let ![]()
![Rendered by QuickLaTeX.com \begin{align*} \underset{S}{\int \int } \nabla \vec{F} \cdot \hat{n} \, dS &= \int_0^{2\pi} \int _0^{\frac{\pi}{2}} u\,\, \cancel{\cos \theta} \, \displaystyle \frac{du}{\cancel{\cos \theta}} \, d\phi \\ &= \int_0^{2\pi} \eval{\displaystyle \frac{u^2 }{2}}_0^{\frac{\pi}{2}} \, d\phi\\ &= \int_0^{2\pi} \eval{\displaystyle \frac{\sin^2 \theta}{2}}_0^{\frac{\pi}{2}} \\ &= \int_0^{2\pi} \left( \frac12 - 0 \right)] \, d\phi \\ &= \frac12 \int_0^{2\pi} \, d\phi \\ &= \eval{\frac12 \phi}_0^{2\pi} \\ &= \frac{1}{\cancel{2}} \cdot \cancel{2}\pi \displaystyle - 0 \\ &= \pi\end{align*}](https://www.samartigliere.com/wp-content/ql-cache/quicklatex.com-d97bc9e84987ae3ca5dc776135270d25_l3.png)
From this, we can see that calculation of our line integral and surface integral yield the same value: ![]() . Therefore, since our choice of vector field and surface were chosen arbitrarily, we’ve proven what we set out to prove and our results are generally applicable.
. Therefore, since our choice of vector field and surface were chosen arbitrarily, we’ve proven what we set out to prove and our results are generally applicable.
VII. 3D Divergence Theorem
VII.1 Intuition
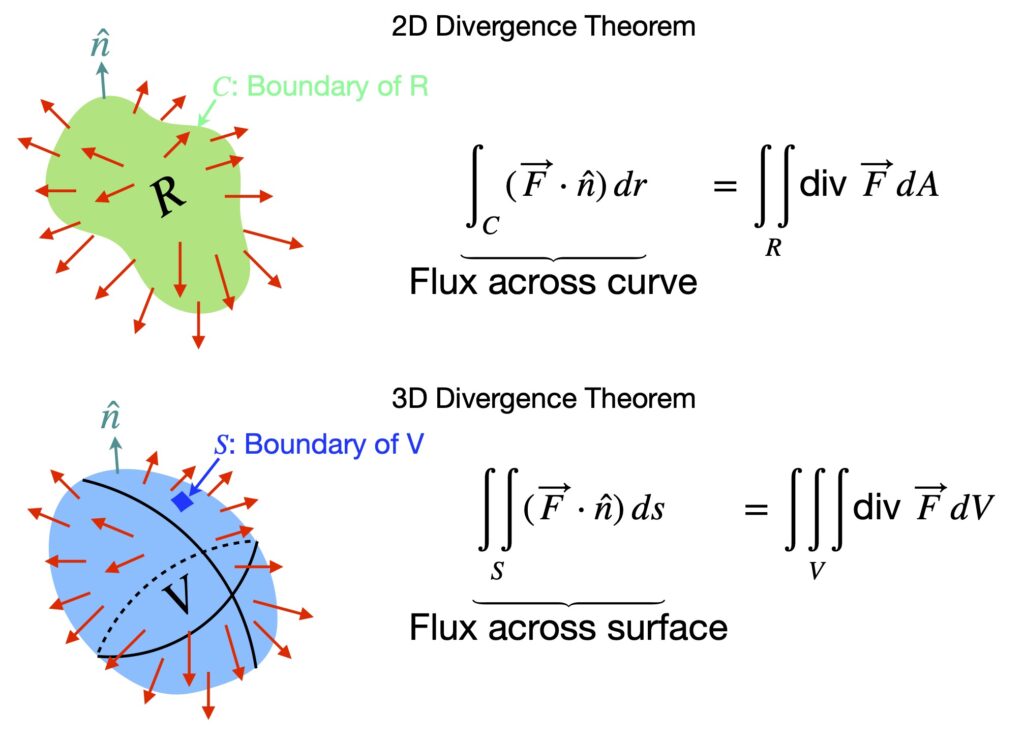
We’ve already seen the 2D version of the divergence theorem: it states that the flux of a vector field across a curve enclosing an area ![]() is equal to the sum of all the divergences in that area.
is equal to the sum of all the divergences in that area.
The 3D divergence theorem states that the flux across a surface ![]() that encloses a volume
that encloses a volume ![]() is equivalent to the sum of the divergences within that volume.
is equivalent to the sum of the divergences within that volume.
VII.2 Proof
Figure 7.1.1 shows the equation for the 3D divergence theorem. I’ll reproduce it here:
![Rendered by QuickLaTeX.com \[ \underset{S}{\int \int } (\vec{F}\cdot \hat{n})\,ds = \underset{V}{\int \int \int}\text{div }\vec{F}\,dV \quad \text{(7.2.1)} \]](https://www.samartigliere.com/wp-content/ql-cache/quicklatex.com-81fa45f8aabb467f9410dbaea09f83f1_l3.png)
Our strategy will be similar to our proof of the 3D Stokes theorem: we’ll show that each side of the equation produces the same result. The 3D volume we’ll consider is a simple solid region – loosely, a shape that is symmetric about the x and/or y and/or z axis; or more formally, a Type III, II or I 3D object. (An explanation of 3D object types can be found at Khan Academy.)
For our proof, we let ![]() be a vector field defined as:
be a vector field defined as:
![]()
Then
![]()
where, for example, ![]() gives us the component of
gives us the component of ![]() in the x direction.
in the x direction.
Using this, we can re-write the lefthand side of eq. (7.2.1) as:

Turning now to the righthand side of eq. (7.2.1), we can write the divergence of ![]() as:
as:
![]()
where, for example, ![]()
Substituting eq. (7.2.5) into the left side of eq. (7.2.1), we have:

Now we equate eq. (7.2.4) and eq. (7.2.6), as shown in figure 7.2.1.
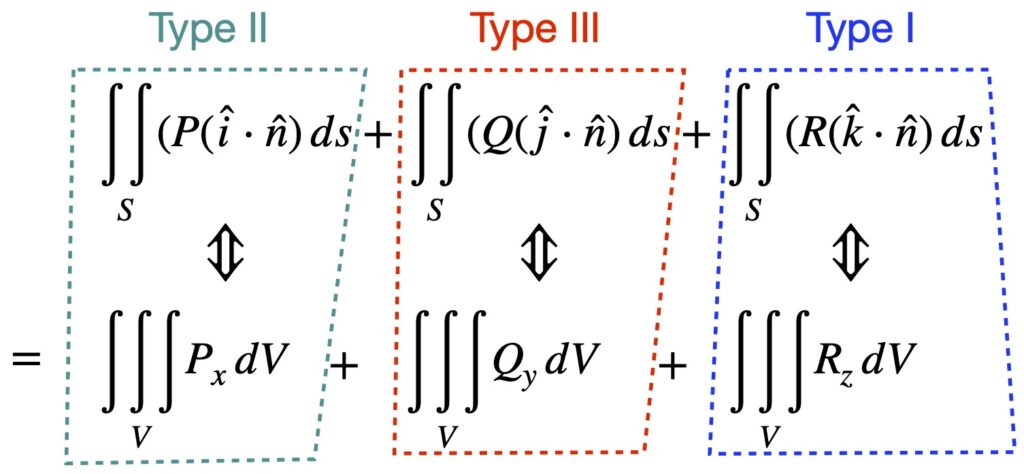
Specifically, we’ll show that the terms enclosed by the blue dotted lines are equivalent. By the same arguments, the terms in red and green can then be equated (although we won’t show those calculations here). The equivalence of all three parts of the equation shown in figure 7.2.1, then, constitutes proof of the 3D divergence theorem. Note that the Type I, Type II and Type III in figure 7.2.1 refer to the type of simple solid 3D object the mathematical objects written in the same color, represent.
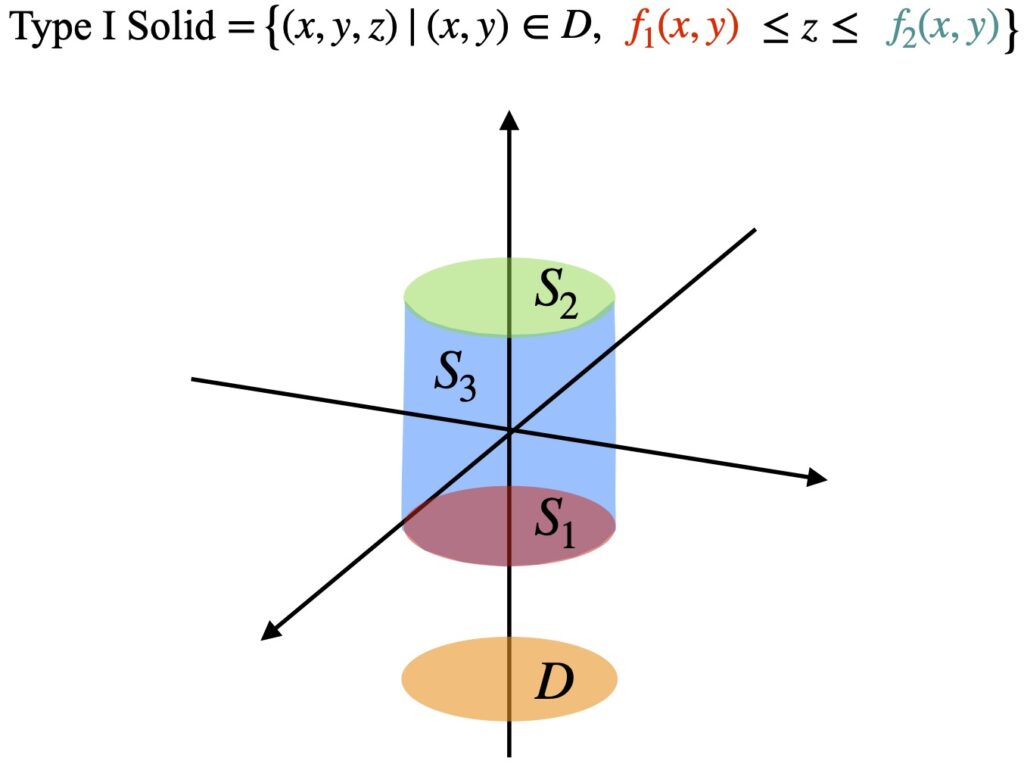
Figure 7.2.2 represents a generic Type I simple solid. We can break it into 3 surfaces: ![]() ,
, ![]() and
and ![]() . And we can break down the integrals that describe this shape into 3 parts as well. We’ll start with the double integral:
. And we can break down the integrals that describe this shape into 3 parts as well. We’ll start with the double integral:
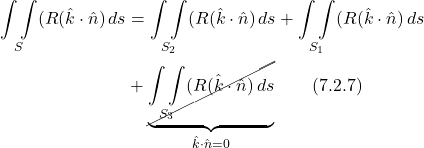
Our unit normal vectors point outward. The unit vector of ![]() is perpendicular to
is perpendicular to ![]() . Therefore, the dot product
. Therefore, the dot product ![]() and the
and the ![]() integral disappears.
integral disappears.
Now we turn our attention to solving the other 2 integrals. We start with the ![]() integral. We begin by parameterizing
integral. We begin by parameterizing ![]() :
:
![]()
Recalling eq. (3.1.4), we have:
![Rendered by QuickLaTeX.com \begin{align*} (\hat{k} \cdot \hat{n})\,ds &= \hat{k} \cdot (\vec{t}_x \times \vec{t}_y)\,dA \\ &= \hat{k} \cdot \begin{vmatrix} \hat{i} & \hat{j} & \hat{k} \\ 1 & 0 & \frac{\partial f_2}{\partial x} \\ 0 & 1 & \frac{\partial f_2}{\partial y} \end{bmatrix}\,dA \\ &= \hat{k} \cdot \left[ (\cdots) \hat{i} + (\cdots) \hat{j} + (1) \hat{k} \right]\, dA \\ &= dA \quad \text{(7.2.8)} \end{align*}](https://www.samartigliere.com/wp-content/ql-cache/quicklatex.com-fce50932bd956acf9c9b401ccd23256c_l3.png)
*I represented the expressions multiplying ![]() and
and ![]() with
with ![]() because it doesn’t matter what
because it doesn’t matter what ![]() is, since
is, since ![]() is orthogonal to
is orthogonal to ![]() and
and ![]() ; thus, their dot products are 0.
; thus, their dot products are 0.
From this, we can see that our ![]() integral becomes:
integral becomes:
![Rendered by QuickLaTeX.com \[ \underset{S_2}{\int \int } R(\hat{k} \cdot \hat{n})\,ds = \underset{D}{\int \int } R(x,y,f_2(x,y))\,dA \quad \text{(7.2.9)} \]](https://www.samartigliere.com/wp-content/ql-cache/quicklatex.com-d31416089068ad28b3656f02fcf3c881_l3.png)
We perform the same procedure on the ![]() integral
integral ![]() . We begin by parameterizing our surface,
. We begin by parameterizing our surface, ![]() :
:
![]()
Next, we find ![]() :
:
![Rendered by QuickLaTeX.com \begin{align*} (\hat{k} \cdot \hat{n})\,ds &= \hat{k} \cdot (\vec{e}_x \times \vec{e}_y)\,dA \\ &= \hat{k} \cdot \begin{vmatrix} \hat{i} & \hat{j} & \hat{k} \\ 0 & 1 & \frac{\partial f_1}{\partial y} \\ 1 & 0 & \frac{\partial f_1}{\partial x} \end{bmatrix}\,dA \\ &= \hat{k} \cdot \left[ (\cdots) \hat{i} + (\cdots) \hat{j} - (1) \hat{k} \right]\, dA \\ &= -dA \quad \text{(7.2.11)} \end{align*}](https://www.samartigliere.com/wp-content/ql-cache/quicklatex.com-d973e114c82845bbd4b83ce75791ae85_l3.png)
Then:
![Rendered by QuickLaTeX.com \[ \underset{S_1}{\int \int } R(\hat{k} \cdot \hat{n})\,ds = -\underset{D}{\int \int } R(x,y,f_1(x,y))\,dA \quad \text{(7.2.12)} \]](https://www.samartigliere.com/wp-content/ql-cache/quicklatex.com-368f94a3a26e62b921ec759520228e57_l3.png)
Putting eq. (7.2.9) and eq. (7.2.12) back into eq. (7.2.7), the final expression for our double integral is:
![Rendered by QuickLaTeX.com \[ \underset{S}{\int \int } (R(\hat{k} \cdot \hat{n})\,ds = \underset{D}{\int \int } \left[R(x,y,f_2(x,y)) - R(x,y,f_1(x,y))\right]\,dA \quad \text{(7.2.13)} \]](https://www.samartigliere.com/wp-content/ql-cache/quicklatex.com-d75878fa88e4512b9b2a005347a9a354_l3.png)
What we have left to do is show that our triple integral is the same as eq. (7.2.13). From eq. (7.2.6), the triple integral for which we’re trying to obtain an expression is:
![Rendered by QuickLaTeX.com \begin{align*} \underset{V}{\int \int \int} R_z\,dV &= \underset{D}{\int \int } \left[ \int_{f_1(x,y)}^{f_2(x,y)} \frac{\partial R}{\partial z}\,dz \right] \, dA \\ &= \underset{D}{\int \int } \left[R(x,y,f_2(x,y)) - R(x,y,f_1(x,y))\right]\,dA \quad \text{(7.2.14)} \end{align*}](https://www.samartigliere.com/wp-content/ql-cache/quicklatex.com-c040bc09041726e90705748c7055d362_l3.png)
We can see that eq. (7.2.13) and eq. (7.2.14) are equal, thus proving what we wanted to prove.


